Arrow Linear Diagram for Visualizing Data Flow – Innovative Approach
RJ0700024_27
- Last Update 07/28/2025
- File Size 3.1MB
- # of Slides 2
- File Format PPTX
- Slide Ratio 16:9
- Color
Keywords
About the Product
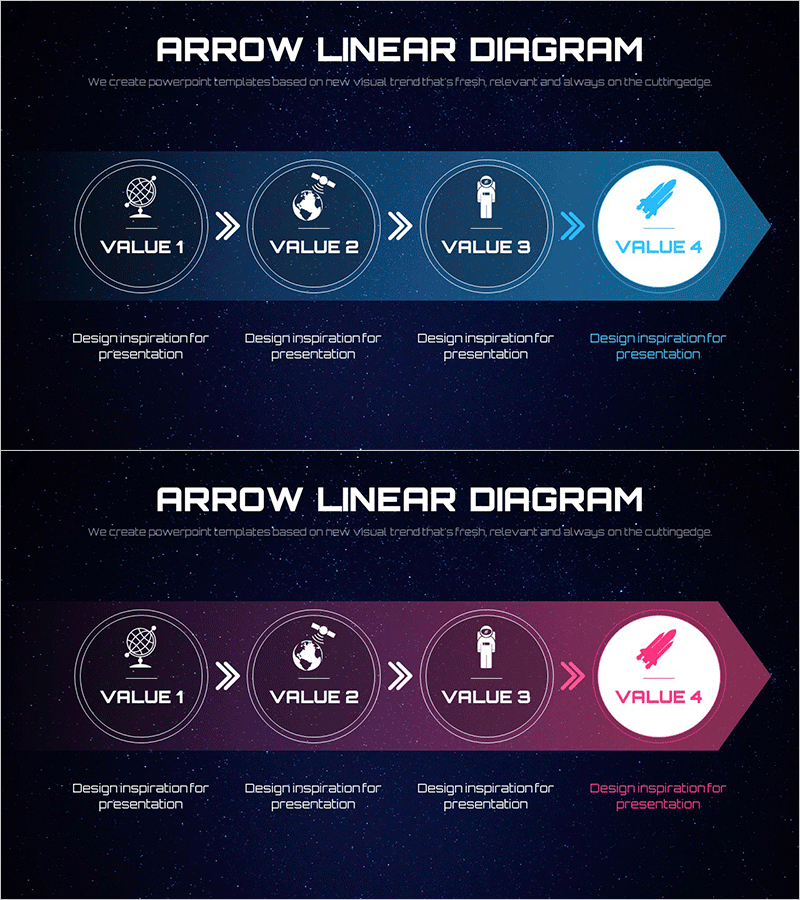
A professional arrow linear diagram PowerPoint slide that visualizes data flow and business processes across 4 sequential steps. Designed with a dark blue and pink dual-tone color scheme, each stage features circular nodes with icons to enhance information clarity and visual hierarchy. This 2-slide template in 16:9 widescreen format is ready for immediate use in presentations requiring step-by-step progression visualization. Ideal for business progress reports, strategic roadmaps, project timelines, and process-driven presentations.
Usage Points
-
Main Usage
Clearly visualize sequential business processes, project phases, strategic roadmaps, and data flows across 4 distinct stages. Circular nodes combined with icons effectively communicate each stage's core concept, improving audience comprehension and engagement.
-
How to Use
Apply to business progress presentations, strategic planning meetings, project kickoff sessions, marketing campaign phase explanations, and executive briefings. Easily customize node text and icons to match your specific content and organizational context.
-
Recommended For
Executives, project managers, marketing professionals, strategy planners, management consultants, and business analysts. Particularly effective for presentations requiring clear stage-by-stage progression communication to senior leadership and external stakeholders.
-
Slide Structure
Four circular nodes connected by directional arrows in a linear progression. First three nodes feature dark blue backgrounds; the final node uses accent color (pink/white) to highlight the end goal. Each node contains icon and text input areas, with descriptive text space positioned below for additional context.
Related Products
-

Fitness Competition Process – Business Strategy Diagram
#Business Strategy #Diagram #Step-by-Step Schedule Plan
-

Companion Flow Diagram – Visualizing Business Strategy
#Business Strategy #Diagram #Step-by-Step Schedule Plan
-

Visual Diagram of Cultural Experience Program Order
#Business Strategy #Diagram #Step-by-Step Schedule Plan
-

Business Direction Illustrated with Camping Infographic
#Business Strategy #Diagram #Step-by-Step Schedule Plan
