Cycle Diagram to Visualize Chemistry Concepts
RJ0700021_29
- Last Update 07/28/2025
- File Size 0.9MB
- # of Slides 2
- File Format PPTX
- Slide Ratio 16:9
- Color
Keywords
- #Content-Based Slides
- #Design-Based Slides
- #Company Introduction
- #Business Introduction
- #Diagram
- #Business Areas
- #Business Areas
- #Flow
- #Circular Flow
- #16:9
- #cycle diagram PowerPoint
- #6-step circular process slide
- #chemistry experiment diagram
- #process flow PowerPoint
- #circular structure slide template
About the Product
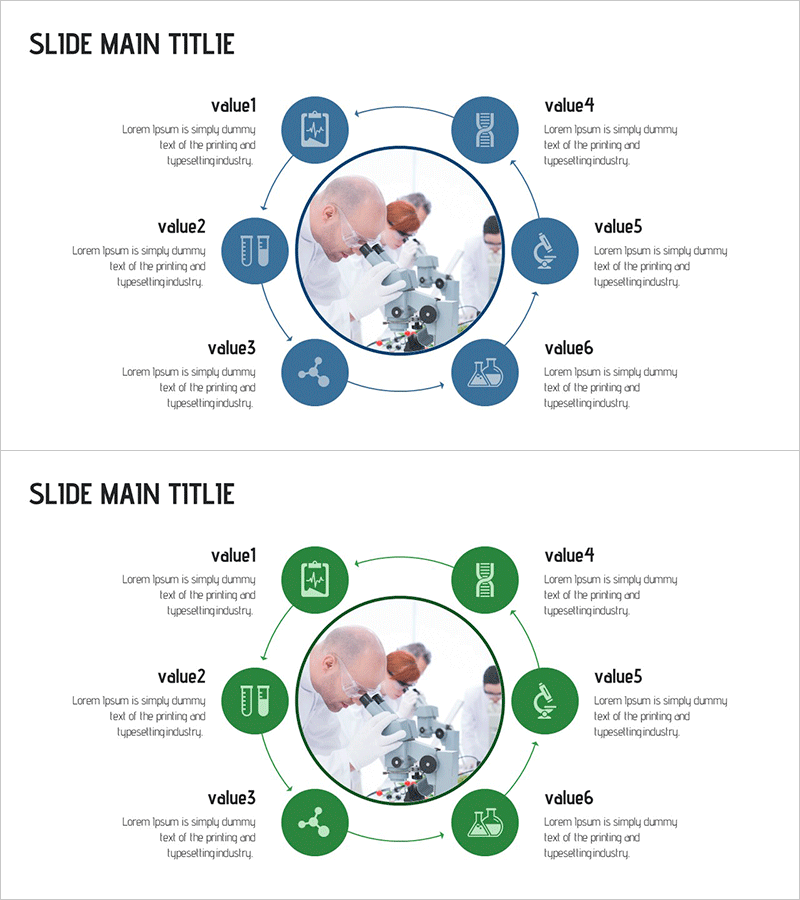
A circular diagram PowerPoint slide featuring six nodes arranged around a central laboratory image in clockwise direction. Available in two color versions: navy blue and forest green, each with experiment equipment icons at each node. This design effectively visualizes chemistry experiment stages, research cycles, and iterative procedures. The slide set includes 2 slides optimized for 16:9 widescreen format in PPTX. Ample text areas below each node allow detailed descriptions, making it immediately ready for presentations, educational materials, research reports, and scientific documentation.
Usage Points
-
Main Usage
Visualizes chemistry experiment stages, research cycles, and iterative procedures across six sequential steps arranged in circular flow. The central laboratory photograph reinforces credibility and scientific expertise. Clear arrow connections and cyclic structure make complex processes easy to understand and follow for academic and professional audiences.
-
How to Use
Enter experiment stage names, procedure descriptions, and time requirements in each node's text area. Guide the audience clockwise through the process flow using the arrow directions. Select navy blue version for trust and stability messaging, or forest green for growth and innovation themes depending on presentation context.
-
Recommended For
Chemistry and life science researchers, university lecturers and seminar instructors, laboratory managers, science education institutions, pharmaceutical and chemical R&D teams, thesis presentations, academic conference speakers, and scientific documentation creators.
-
Slide Structure
Central circular-framed laboratory image surrounded by six evenly-spaced circular nodes connected by directional arrows. Each node contains equipment icon and text label area. Two-slide set: one navy blue version and one forest green version, both maintaining consistent layout and 16:9 aspect ratio.
Related Products
-

Business Area Diffusion Diagram - Flow of Business Domains
#Company Introduction #Business Introduction #Diagram
-

Sketch Icon Business Area Diagram – Visualizing Business Introduction
#Company Introduction #Business Introduction #Diagram
-

Travel Business Relationship Diagram – Innovative Business Model
#Company Introduction #Business Introduction #Diagram
-

Business Area Diffusion Diagram – At the Center of Business Growth
#Company Introduction #Business Introduction #Diagram
