Infographic Slide for Data Visualization and Analysis
RJ0700021_10
- Last Update 07/28/2025
- File Size 2.4MB
- # of Slides 2
- File Format PPTX
- Slide Ratio 16:9
- Color
Keywords
- #Content-Based Slides
- #Design-Based Slides
- #Technical Approach
- #Market and Competitor Analysis
- #Graph
- #Research and Development
- #Market Analysis
- #Line
- #Line Chart
- #16:9
- #line chart PowerPoint slide
- #trend analysis presentation template
- #data visualization chart
- #dual-series graph template
- #business analytics slide download
About the Product
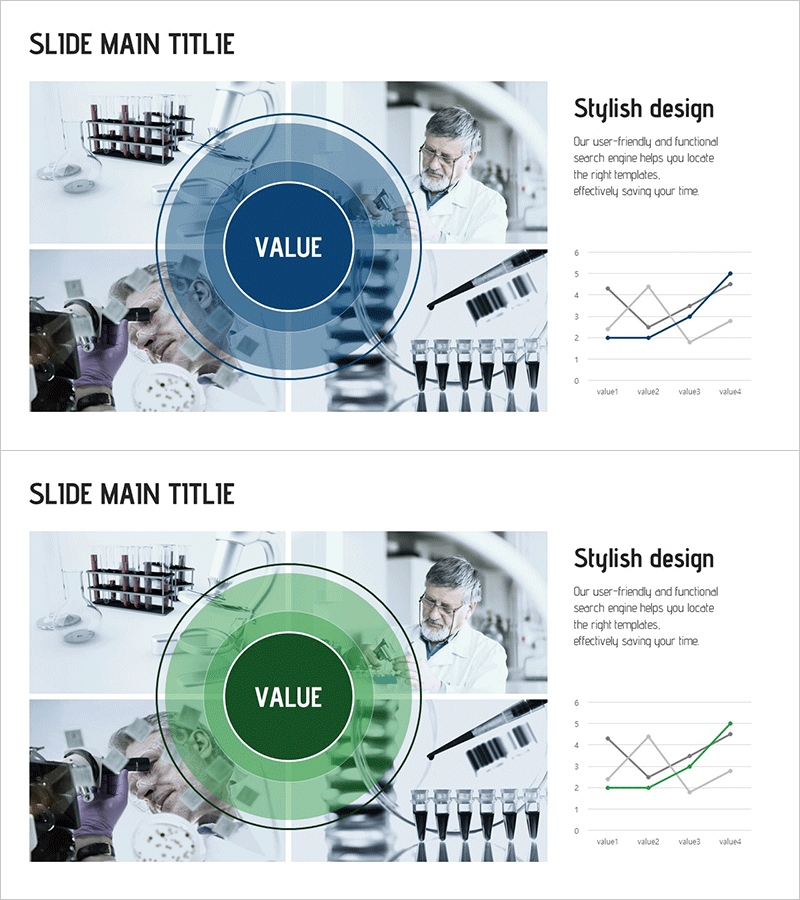
A professional line chart PowerPoint slide designed to clearly visualize data trends and performance changes. This 2-slide template features a dark blue central diagram with dual-series line graphs, ideal for business analysis, market trend presentations, and performance reporting. The layout combines industrial background imagery with data visualization elements, emphasizing technical expertise and analytical credibility. Perfect for comparing two data series over time and communicating change patterns intuitively. Delivered as an editable 16:9 widescreen PPTX file.
Usage Points
-
Main Usage
Visualize numerical changes over time by comparing two data series, such as sales trends, customer satisfaction metrics, or performance improvements. Ideal for communicating quarterly, monthly, or annual performance comparisons and strategic insights.
-
How to Use
Enter your core message in the central VALUE diagram and input actual data into the dual-series line chart on the right. The industrial background imagery reinforces technical credibility, making it suitable for quarterly reports, market analysis, and strategic planning presentations.
-
Recommended For
Data analysts, executives, marketing managers, and technical leaders presenting performance reports, market analysis, and strategic initiatives. Particularly effective for financial, IT, manufacturing, and healthcare industries requiring analytical credibility.
-
Slide Structure
2-slide template: Slide 1 features a dark blue circular diagram (VALUE-centered) with 4 data points; Slide 2 displays a dual-series line chart with 4 X-axis categories and 0-6 Y-axis range showing trend progression. 16:9 widescreen PPTX format.
Related Products
-

Line Chart of the Violence Survey – Market Analysis and Competitive Advantage
#Market and Competitor Analysis #Graph #Market Analysis
-

Competitor Analysis Broken Line Graph - Visualizing Market Trends
#Market and Competitor Analysis #Graph #Competitor Analysis
-

Line Chart of Notepad Frame – Market and Competitor Analysis
#Market and Competitor Analysis #Graph #Future Outlook
-

Adventure Business Line Graph Slide for Market Research
#Market and Competitor Analysis #Graph #Market Analysis
