Gradient Color Cycle Diagram – Product and Service Strategy
RJ0700017_24
- Last Update 07/26/2025
- File Size 1.2MB
- # of Slides 2
- File Format PPTX
- Slide Ratio 16:9
- Color
Keywords
- #Content-Based Slides
- #Design-Based Slides
- #Product/Service Introduction
- #Marketing Plan and Strategy
- #Diagram
- #Differentiation Strategy for Products/Services
- #Marketing Strategy
- #Flow
- #Cluster
- #Circular Flow
- #Chain Diagram
- #16:9
- #cycle diagram PowerPoint
- #3-stage circular diagram
- #gradient PowerPoint slide
- #product strategy diagram
- #circular flow PPT slide
About the Product
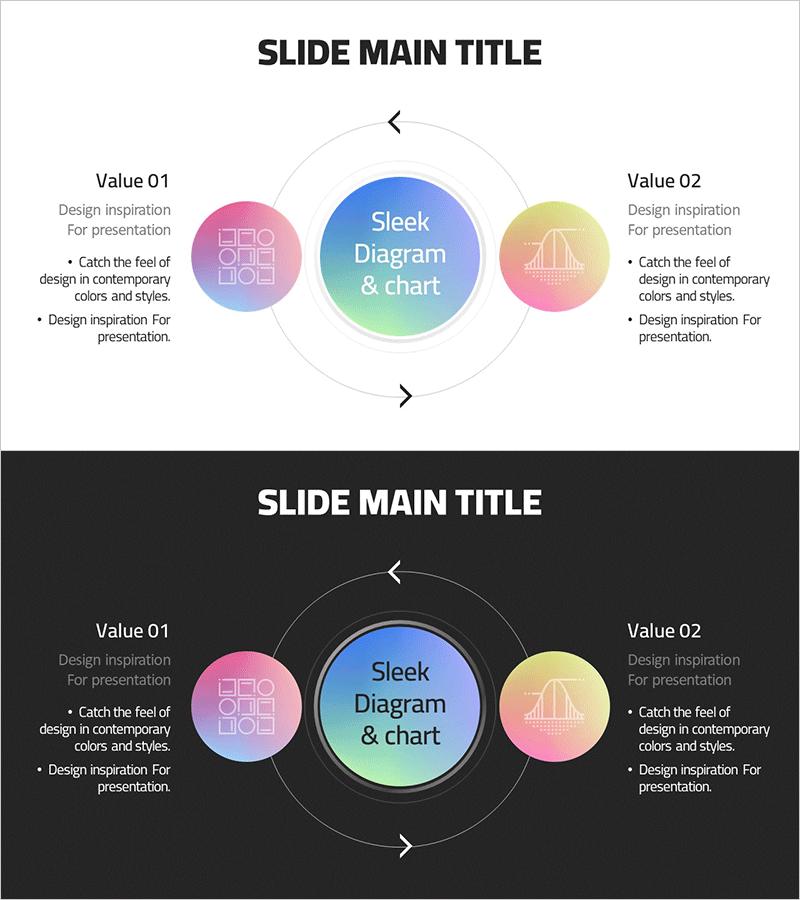
A 3-stage cycle diagram PowerPoint slide designed to visualize product and service strategy. Three circular nodes positioned on the left, right, and bottom are connected to a central circular element via arrows, creating a clear cyclical flow structure. Each node features gradient colors—pink, blue, and yellow—to distinguish stages, with icon placeholders and text areas for presenting value propositions, differentiation factors, and execution strategies. The 16:9 widescreen format includes 2 slides with both light and dark background versions, ready for immediate use in any presentation environment.
Usage Points
-
Main Usage
Illustrate cyclical processes and three interconnected elements in product development, service innovation, and marketing strategy. The central concept connects to three surrounding value elements in a rotating pattern, enabling audiences to grasp integrated strategy frameworks and continuous improvement cycles at a glance.
-
How to Use
Enter key values or strategy phases (Value 01, Value 02, Value 03) into each circular node, and add detailed descriptions in the text areas below. Customize icons to reflect industry or departmental characteristics. Alternate between light and dark background versions throughout your presentation to create visual variety and maintain audience engagement.
-
Recommended For
Ideal for product marketing managers, strategy planning teams, and executive presentations. Effective for new product launch strategies, service innovation plans, competitive differentiation explanations, and business model cycle structures. Applicable across consulting, advertising, IT, and manufacturing industries for strategic planning and decision-making meetings.
-
Slide Structure
One central circular node (core concept) with three surrounding nodes (Value 01, 02, 03) positioned left, right, and bottom. Clockwise arrows connect all nodes to show cyclical flow. Each node includes an icon area and text input field, with additional description text areas below the left and right nodes. Two-slide set with light background (white) and dark background (black) versions.
Related Products
-

Successful Global Marketing Strategy Diagram
#Product/Service Introduction #Marketing Plan and Strategy #Diagram
-

Service Differentiation Strategy Diagram – Effective Marketing Strategy
#Product/Service Introduction #Marketing Plan and Strategy #Diagram
-

Interior Progress Process – Visualization of Business Strategy
#Business Vision and Strategy #Marketing Plan and Strategy #Diagram
-

Business Service Differentiation Strategy Diagram – Cluster Approach for Effective Marketing
#Product/Service Introduction #Marketing Plan and Strategy #Diagram
