Visualizing Strategic Flow with Arrow Goal Diagram
RJ0300060_11
- Last Update 05/04/2025
- File Size 0.1MB
- # of Slides 2
- File Format PPTX
- Slide Ratio 16:9
- Color
Keywords
- #Content-Based Slides
- #Design-Based Slides
- #Product/Service Introduction
- #Marketing Plan and Strategy
- #Diagram
- #Differentiation Strategy for Products/Services
- #Marketing Strategy
- #Flow
- #Cluster
- #Linear Flow
- #Chain Diagram
- #16:9
- #arrow diagram PowerPoint
- #process flow diagram slide
- #strategic flow visualization PPT
- #two-stage diagram template
- #connection diagram PowerPoint slide
About the Product
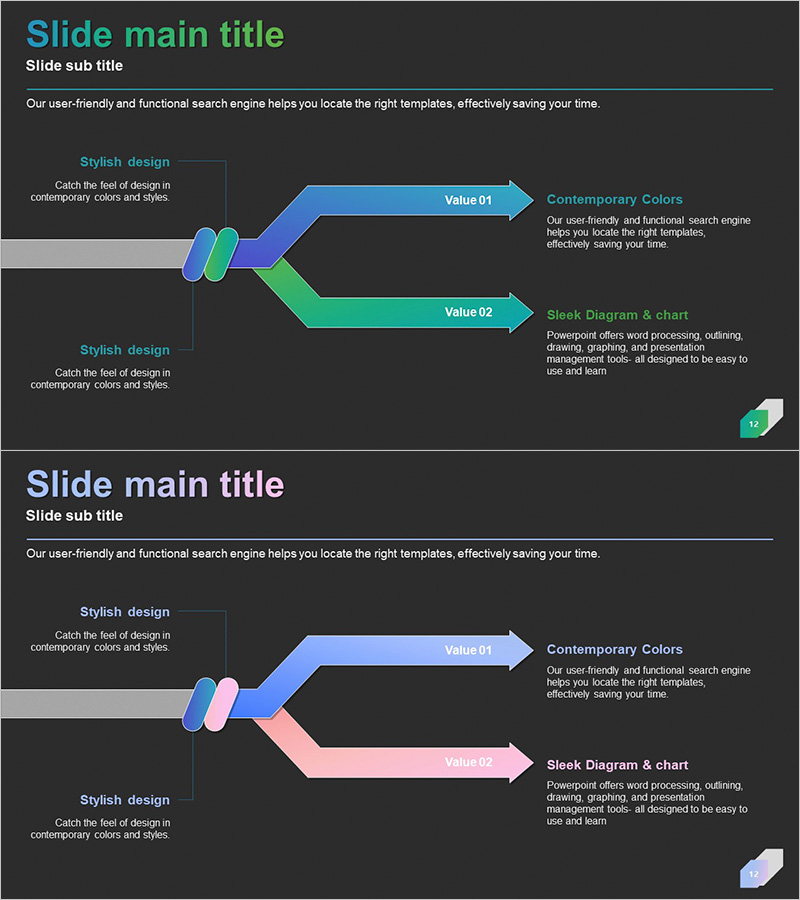
A PowerPoint slide featuring an arrow connection diagram that visualizes strategic flow and process progression. Set against a dark background, the design uses blue and green arrow connectors with circular nodes to represent a two-stage process, each labeled with Value indicators and description text areas. This presentation template is ready to use for product and service introductions, marketing strategy presentations, and business process explanations. Provided in 16:9 PPTX format with fully editable colors, text, and arrow directions for customization.
Usage Points
-
Main Usage
Optimized for visualizing strategic processes and multi-stage workflows with clarity and impact. The arrow connectors and circular nodes effectively represent linear progression, while Value labels emphasize key outcomes at each stage. Ideal for illustrating product development phases, marketing campaign timelines, business strategy implementation, and operational workflows.
-
How to Use
Customize arrow colors and node sizes through the slide master to match your brand identity. Edit the 'Value 01 & 02' labels and right-side description areas with your actual process stage names and detailed content. Add or remove nodes and adjust arrow directions as needed to accommodate different workflow structures and complexity levels.
-
Recommended For
Recommended for executives, marketing teams, and sales professionals presenting product and service introduction sections with development stages or service delivery processes. Effective for business plan strategy pages, marketing plan campaign timelines, investment pitch deck business model explanations, and consulting reports. Also suitable for educational seminars and training materials requiring conceptual flow visualization.
-
Slide Structure
Two-slide set with identical dark background layouts featuring two circular nodes on the left and two arrow connectors on the right. The first arrow is blue-toned, the second green-toned, each with 'Value' labels at endpoints. Right side includes dedicated title and description text areas for each stage, enabling easy information input and customization.
Related Products
-

Infographic for Weather Comparison – Stylish Design
#Product/Service Introduction #Marketing Plan and Strategy #Diagram
-

Gradient Overlay Circular Diagram – Visualizing Business Strategy
#Business Vision and Strategy #Marketing Plan and Strategy #Diagram
-

Corporate Strategy Diagram Leading the Future – Visualizing Business Flow
#Business Vision and Strategy #Marketing Plan and Strategy #Diagram
-

Parenting Education Diagram – Product/Service Introduction and Marketing Strategy
#Product/Service Introduction #Marketing Plan and Strategy #Diagram
