Scientific Research Planning Diagram – Business Strategy
RJ0700015_29
- Last Update 07/26/2025
- File Size 0.7MB
- # of Slides 2
- File Format PPTX
- Slide Ratio 16:9
- Color
Keywords
- #Content-Based Slides
- #Design-Based Slides
- #Business Strategy
- #Operational Plan
- #Diagram
- #Business Processes
- #Flow
- #Linear Flow
- #Project Progress
- #16:9
- #linear flow diagram PowerPoint
- #4-stage process slide
- #business progress timeline template
- #step-by-step flowchart PPT
- #project phase diagram download
About the Product
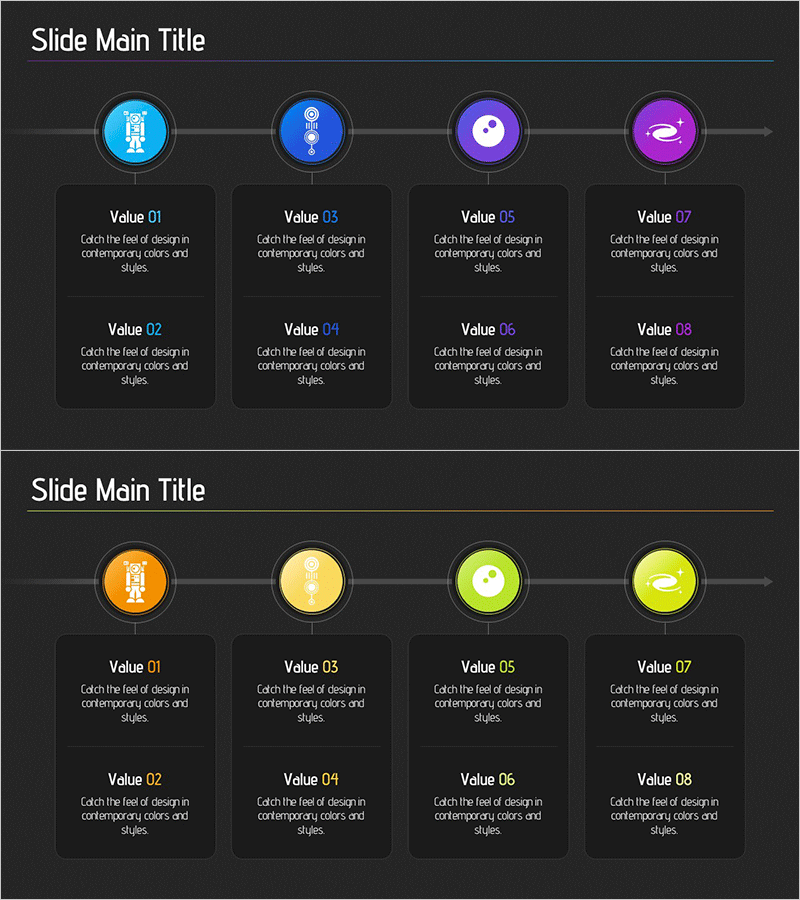
A 4-stage linear flow diagram PowerPoint slide designed to visualize business progress and project milestones. Features circular icons in blue, purple, and pink gradient colors connected by directional arrows on a dark background. Each stage includes editable text boxes for titles and descriptions. The 2-slide set offers a 4-node overview layout on slide 1 and an expanded 8-node (2-row) configuration on slide 2. Ideal for presenting sequential processes such as project phases, research development stages, business strategy implementation, and operational timelines in professional presentations.
Usage Points
-
Main Usage
Clearly visualize sequential business processes, project phases, research development stages, and strategic implementation timelines. Each stage displays objectives, activities, and outcomes to enhance audience comprehension and engagement.
-
How to Use
Edit text boxes beneath each circular icon to add stage names and descriptions. Customize colors to match your corporate brand while maintaining the gradient effect. Use slide 1 for a 4-stage overview and slide 2 for detailed 8-stage explanations.
-
Recommended For
Executives and project managers presenting business progress reports, HR teams explaining onboarding processes, research teams showcasing development timelines, and investors pitching strategic roadmaps.
-
Slide Structure
2-slide set in 16:9 widescreen format. Slide 1: 4 circular nodes connected left-to-right with arrows, 2 editable text boxes per node. Slide 2: 8 nodes in 2-row layout (4 top, 4 bottom) with corresponding text boxes. PPTX format, fully editable.
Related Products
-

Achievements and Stage Diagram – Visualizing Business Progress
#Business Strategy #Operational Plan #Diagram
-

Performance and System Diagram for Business Strategies – Efficient Operation and Strategic Advancement
#Business Strategy #Operational Plan #Diagram
-

Animal Farm Arrow Flow Linear – Business Strategy
#Business Strategy #Operational Plan #Diagram
-

Echo Service Process Diagram – Sustainable Business Strategy
#Business Strategy #Operational Plan #Diagram
