Space Industry Analysis Curve Graph - Strengthening Market Competitiveness
RJ0700013_23
- Last Update 07/25/2025
- File Size 1.2MB
- # of Slides 2
- File Format PPTX
- Slide Ratio 16:9
- Color
Keywords
About the Product
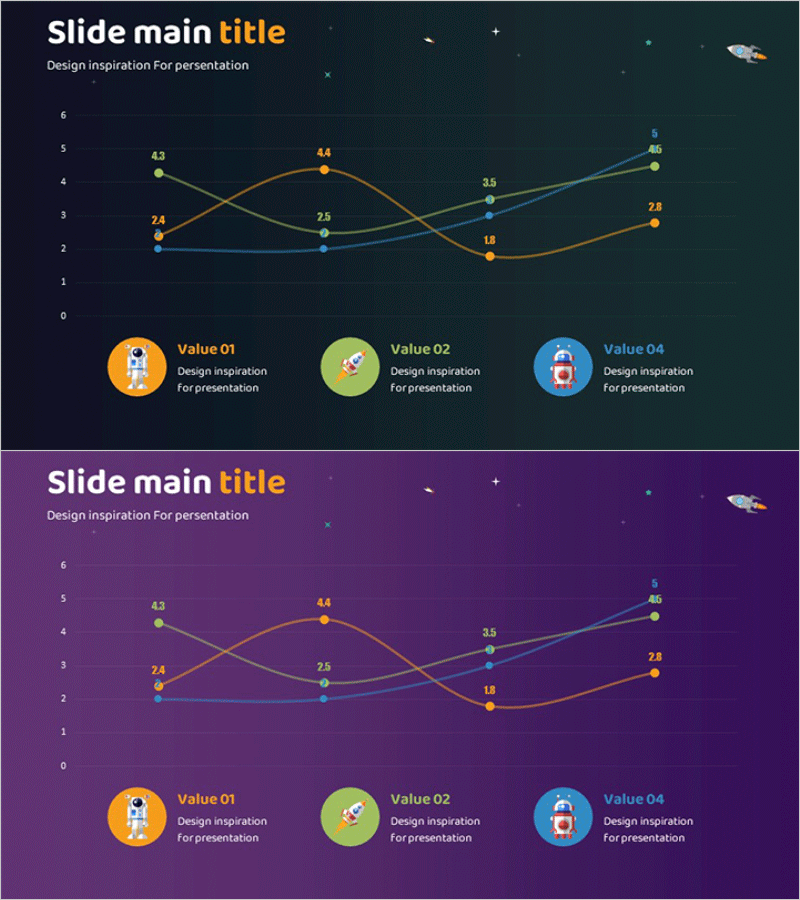
A multi-line curve graph PowerPoint slide designed for space industry and market competitiveness analysis. Features a dark teal or purple background with three data series in orange, green, and blue, visualizing four data points across the chart. The bottom section includes an icon-based legend (Value 01–04) for clear data identification. Provided in 2-slide format with identical layouts in different background colors for consistent presentation branding. Ready to use for market share comparisons, competitive performance benchmarking, and industry trend analysis presentations.
Usage Points
-
Main Usage
Simultaneously display competitor performance metrics, industry trend trajectories, and market share evolution using multiple curves to reveal competitive dynamics at a glance. Supports data-driven strategic decision-making and competitive positioning analysis.
-
How to Use
Replace Y-axis and X-axis labels with your actual metrics, update data point values to reflect real analysis figures, and change legend text (Value 01–04) to competitor names or KPI labels. Select the background color variant (teal or purple) that matches your presentation theme.
-
Recommended For
Executive presentations on competitive strategy, investor pitches on market positioning, marketing team competitive analysis reports, sales team market landscape briefings, and strategic planning sessions requiring competitive benchmarking data.
-
Slide Structure
Title area (upper left text input), main multi-line curve graph (Y-axis 0–6 scale, X-axis with 4 data points, 3 distinct curves), and bottom icon-based legend (3 value categories with descriptive text). Limited text input areas (title, subtitle, legend descriptions); data structure is comparative with multiple series.
Related Products
-

Competitor Comparative Analysis Slide – Emphasizing Market and Competitiveness
#Market and Competitor Analysis #Graph #Text Box
-

Area Graph – Effective Visualization for Market and Competitor Analysis
#Market and Competitor Analysis #Graph #Other
-

Third Party Comparison Analysis Line Graph – Highlighting Market Competitiveness
#Market and Competitor Analysis #Graph #Competitor Analysis
-

Broken Line Comparison Analysis Graph – Market and Competitor Analysis
#Market and Competitor Analysis #Graph #Competitor Analysis
