Broken Line Comparison Analysis Graph – Market and Competitor Analysis
RJ0300077_12
- Last Update 05/10/2025
- File Size 1MB
- # of Slides 2
- File Format PPTX
- Slide Ratio 16:9
- Color
Keywords
About the Product
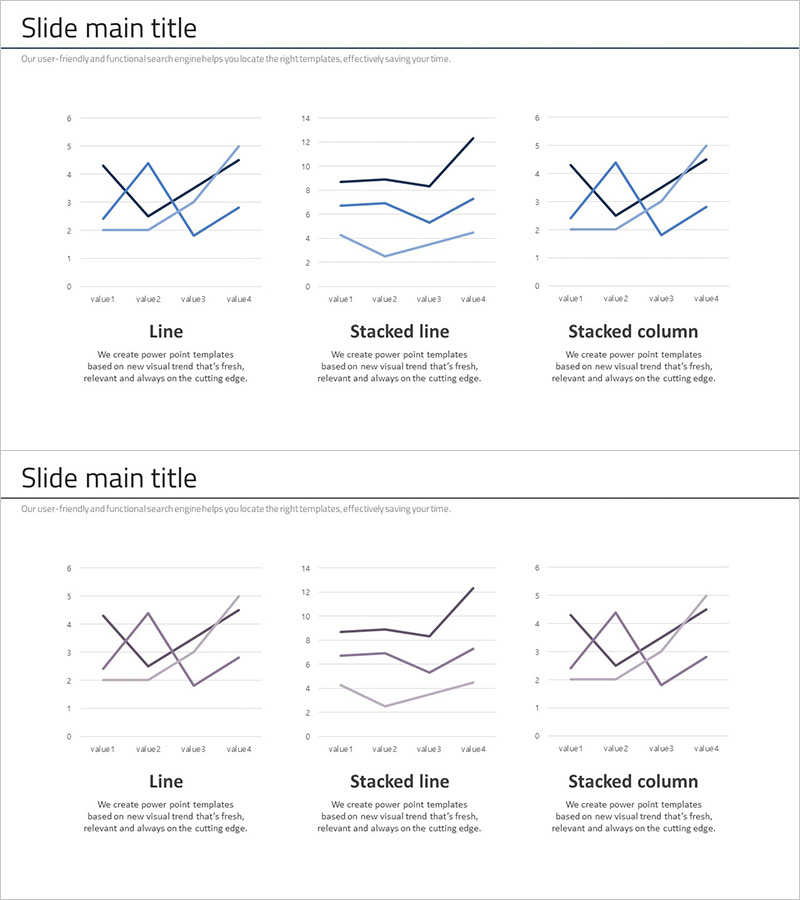
A PowerPoint slide deck optimized for market analysis and competitive benchmarking with multi-series line charts. The 2-slide set presents three data visualization approaches: line chart, stacked line chart, and stacked column chart. Against a neutral gray background, blue-toned lines enable simultaneous comparison of multiple performance indicators and market trends. Each slide includes a title section and descriptive text area for clear presentation context. Ready to integrate into business plans, investor pitch decks, and marketing strategy documents for competitive positioning analysis.
Usage Points
-
Main Usage
Visualize competitive positioning and market trend analysis through multi-series data representation. Display competitor performance metrics or market share evolution simultaneously to establish clear decision-making foundations. Effectively communicate competitive landscape to investors and executives in high-stakes presentations.
-
How to Use
Enter analysis topic in the slide title area (e.g., market share, revenue trends, customer satisfaction). Input actual data into each chart format. Use line charts for simple trend comparison, stacked line charts for component-based cumulative trends, and stacked column charts for period-to-period comparison. Refine legends and axis labels for audience clarity.
-
Recommended For
Ideal for competitive analysis sections in business plans, market positioning in investor pitch materials, competitor benchmarking in marketing strategy documents, and trend analysis in quarterly performance reports. Suitable for strategy planning meetings, executive briefings, and investor presentations requiring data-driven decision support.
-
Slide Structure
Two-slide layout with each slide containing a title section (single-line text), central chart area (three graphs side-by-side), and descriptive text footer. First slide displays line, stacked line, and stacked column charts in parallel arrangement. Second slide mirrors this structure, enabling multiple analytical perspectives on the same data.
Related Products
-

Third Party Comparison Pentagon Area Graph – Competitive Advantage Analysis
#Market and Competitor Analysis #Graph #Competitor Analysis
-

Doughnut Chart Presentation for Pet Store Competitor Analysis
#Market and Competitor Analysis #Graph #Competitor Analysis
-

Competitive Comparison Analysis Bar Graph – Visualizing Market Advantage
#Market and Competitor Analysis #Graph #Competitor Analysis
-

Market Competition: Deep Dive into Top 3 Firms
#Market and Competitor Analysis #Graph #Competitor Analysis
