Target Market Progress Graph – Effective Marketing Strategy
RJ0700013_22
- Last Update 07/25/2025
- File Size 1.6MB
- # of Slides 2
- File Format PPTX
- Slide Ratio 16:9
- Color
Keywords
- #Content-Based Slides
- #Design-Based Slides
- #Market and Competitor Analysis
- #Marketing Plan and Strategy
- #Graph
- #Other
- #Target Market
- #Target Market Strategy
- #Circles
- #Doughnut Chart
- #16:9
- #donut chart PowerPoint
- #pie chart slide template
- #marketing progress graph
- #goal achievement visualization
- #3-segment circular chart
About the Product
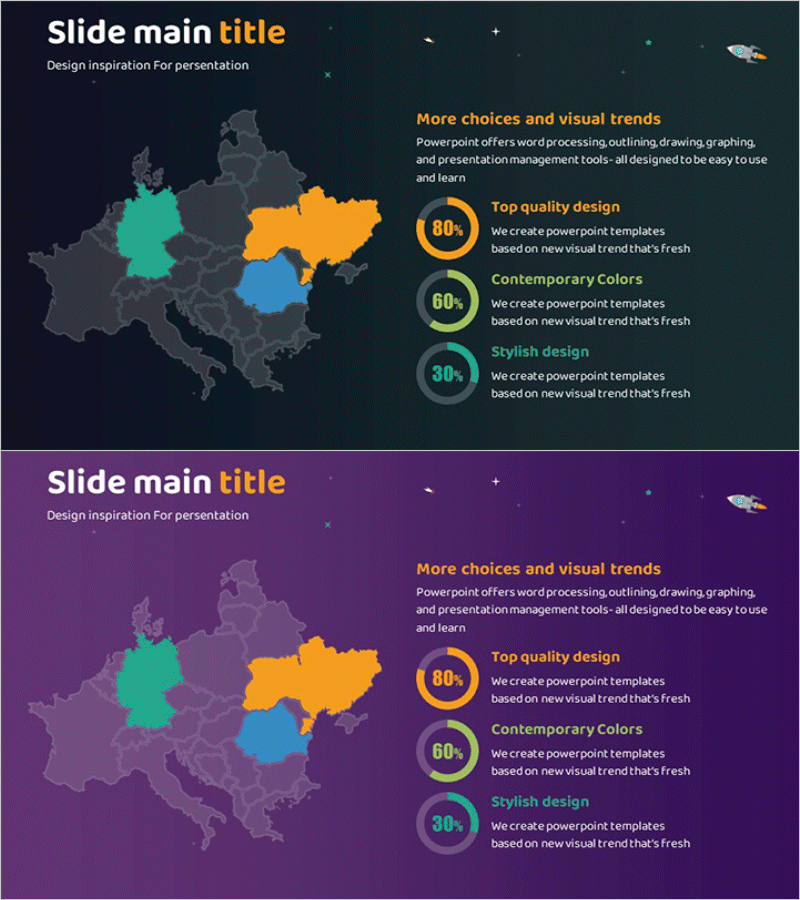
A professional donut chart PowerPoint slide optimized for marketing strategy presentations. The three-segment circular graph visualizes target market progress, goal achievement rates, and strategy execution percentages at a glance. Set against a dark background with turquoise, orange, and blue accent colors, the data areas feature clear percentage values and descriptive text labels for immediate use in reports, proposals, and strategic presentations. Delivered as a 2-slide 16:9 widescreen PPTX file with fully editable elements for seamless customization.
Usage Points
-
Main Usage
Simultaneously visualizes three key performance indicators such as target market progress, goal achievement rates, and strategy execution percentages. The donut structure allows central placement of additional metrics or core figures, making it ideal for marketing reports, quarterly performance reviews, and strategic planning sessions where data comparison must be communicated intuitively.
-
How to Use
Open the slide and replace each segment's percentage values and labels with your own data. Colors can be adjusted to match brand guidelines, and text description areas can be populated with marketing objectives, strategies, and outcomes to complete your presentation. The dark background ensures clarity when projected in conference room environments.
-
Recommended For
Marketing managers, sales directors, executive reporting teams, and business planning departments benefit from this template when presenting quarterly or annual performance, market entry strategies, and customer segmentation analysis results. It excels in situations requiring balanced representation of three or more comparative items.
-
Slide Structure
Comprises 2 slides with dark backgrounds (dark navy and dark purple) featuring a centered 3-segment donut chart. To the right of each graph are section titles, three percentage-labeled circular icons (80%, 60%, 30%) with descriptive text vertically aligned. A decorative spaceship icon in the upper right corner adds contemporary visual interest to the design.
Related Products
-

Graph of the Status of European Target Region Analysis – Market Trends Visualization
#Market and Competitor Analysis #Marketing Plan and Strategy #Graph
-

Area Graph for Competitor Analysis
#Market and Competitor Analysis #Marketing Plan and Strategy #Graph
-

Infographic Slide for Regional Data Visualization
#Market and Competitor Analysis #Marketing Plan and Strategy #Graph
-

European Market Share Analysis Graph
#Market and Competitor Analysis #Marketing Plan and Strategy #Graph
