Space Theme Area Diagram – Optimized for Market and Competitor Analysis
RJ0700013_14
- Last Update 07/25/2025
- File Size 1.1MB
- # of Slides 2
- File Format PPTX
- Slide Ratio 16:9
- Color
Keywords
About the Product
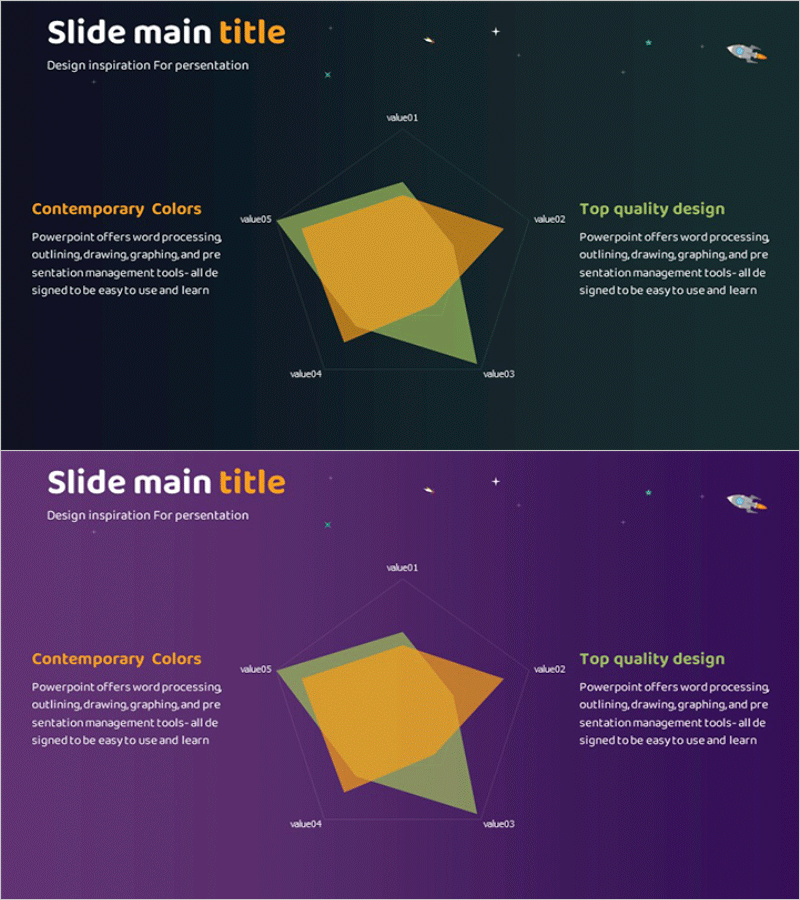
A market analysis PowerPoint slide featuring a space-themed dark background with golden and green area diagrams in a 5-segment layout. This 2-slide set offers background variations in dark navy and purple tones, with left and right text zones flanking a central multi-segment diagram for competitive positioning, market share comparison, and value proposition visualization. Delivered in 16:9 widescreen PPTX format with fully editable elements, ideal for business presentations, investor pitches, and strategic reports where data-driven market insights require clear visual communication.
Usage Points
-
Main Usage
Visualize market positioning, competitive landscape, market share distribution, and value proposition comparison across five distinct segments. Effectively communicates your company's market position and competitive advantages to investors, stakeholders, and partners through data-driven visual representation.
-
How to Use
Enter analysis categories (e.g., price, quality, technology, customer satisfaction) in the left text area labeled 'Contemporary Colors.' Add corresponding descriptions in the right section labeled 'Top quality design.' Adjust the size and color intensity of each segment in the central diagram to represent comparative data across competitors.
-
Recommended For
Strategic planning teams, marketing departments, executive reports, investor relations presentations, and business proposals. Particularly effective for market entry strategies, competitive analysis sections, and positioning strategy discussions that require data-backed decision support.
-
Slide Structure
Two-slide set with dark navy background on slide one and purple background on slide two. Each slide features a left text input area (title + description, 2 rows), a central 5-segment area diagram (gold, green, and gray color scheme), and a right text input area (title + description, 2 rows) for balanced information hierarchy.
Related Products
-

Segmentation Graphs and Analysis Charts – Optimized for Market and Competitor Analysis
#Operational Plan #Market and Competitor Analysis #Graph
-

Market Analysis Slide with Line Charts on TV
#Market and Competitor Analysis #Graph #Other
-

Curve Graph Slide for Analyzing Regional Figures – Effective Data Delivery
#Market and Competitor Analysis #Graph #Other
-

Doughnut Chart Slide Visualizing Market Share by Country
#Market and Competitor Analysis #Graph #Other
