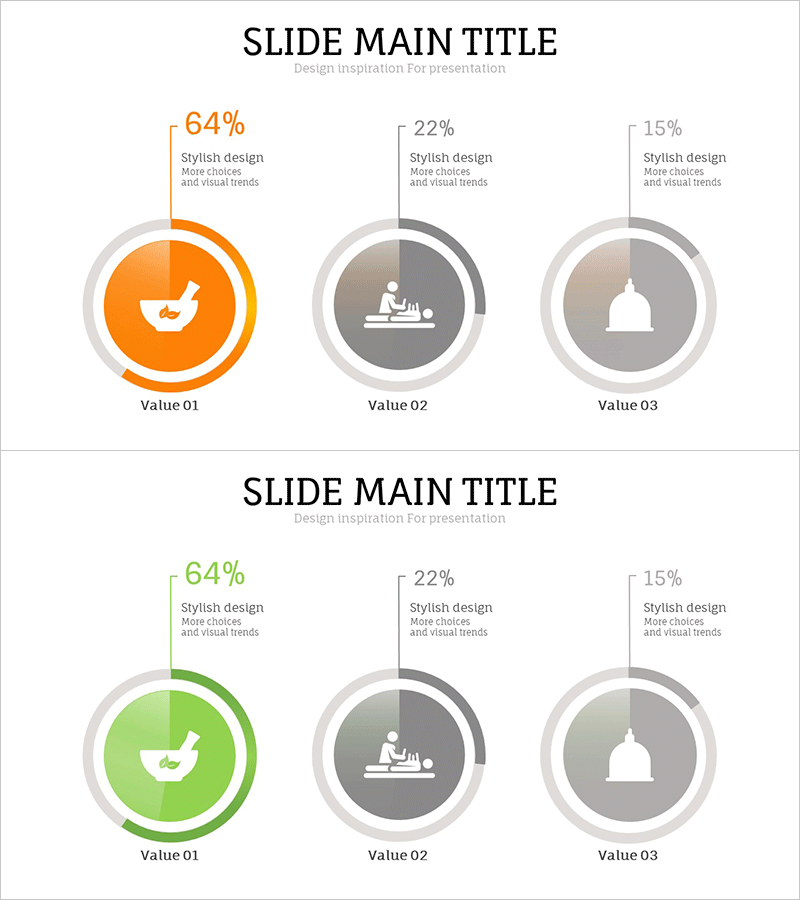
Doughnut Chart Slide Visualizing the Current Status of Herbal Medicine Development
RJ0700011_13
- Last Update 07/24/2025
- File Size 0.3MB
- # of Slides 2
- File Format PPTX
- Slide Ratio 16:9
- Color
Keywords
About the Product
A doughnut chart PowerPoint slide that visualizes the ratio of three items with an orange accent color and gray tone dual-color scheme. Each circular chart features a centered icon to convey categories intuitively, with percentage values and descriptive text displayed alongside. The 2-slide set is suitable for various data comparison scenarios, effectively communicating ratio-based information such as market share, product composition, and resource allocation. Available in 16:9 widescreen PPTX format for immediate editing and customization.
Usage Points
-
Main Usage
Clearly visualize the ratio relationship of three items such as product composition, market share, resource allocation, and customer distribution using circular charts. Emphasize percentage values in each section to create effective comparative analysis materials.
-
How to Use
Insert into the data section of business reports, marketing plans, and analysis documents to enable quick comprehension of numerical information. Use the orange accent color to highlight key items and gray tones to represent supporting information, establishing clear information hierarchy.
-
Recommended For
Recommended for financial analysts, marketing managers, executives preparing reports, consultants, and data analysis professionals who need to effectively communicate ratio-based information. Applicable across various industries including manufacturing, distribution, finance, and IT.
-
Slide Structure
2-slide composition with three doughnut charts arranged on each slide. Circular charts in orange, gray, and gray tones are positioned from left to right, with percentage values and descriptive text displayed above each chart and category names below. Central icons symbolically represent item characteristics.
Related Products
-

Financial Business Analysis Pie Chart – Market Share Insights
#Product/Service Introduction #Market and Competitor Analysis #Graph
-

Website Technology Development Status Graph – Market Share and Trends
#Product/Service Introduction #Market and Competitor Analysis #Graph
-

Business Idea Development Status Graph – Ideas and Growth
#Product/Service Introduction #Market and Competitor Analysis #Graph
-

Analysis graph of market share progress
#Product/Service Introduction #Market and Competitor Analysis #Graph
