



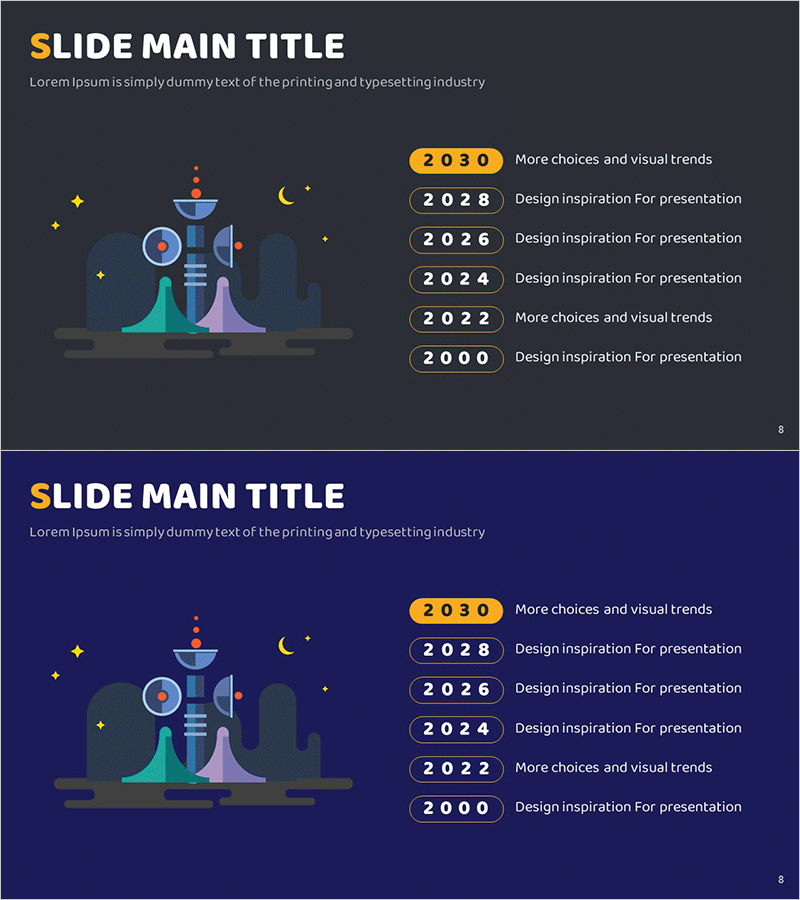
Space Business History Diagram – Future Vision Representation
RJ0700010_7
- Last Update 07/24/2025
- File Size 0.6MB
- # of Slides 2
- File Format PPTX
- Slide Ratio 16:9
- Color
Keywords
About the Product
A PowerPoint slide that visualizes space business history through a 5-stage timeline layout. The dark blue background features golden year badges and cyan-to-purple gradient chart elements that represent future vision. The 2-slide set provides identical layouts for expressing multiple business evolution periods consecutively. With clearly separated text input areas and chart zones, you can immediately edit and apply various timeline information such as company history, technology development, and business expansion stages.
Usage Points
-
Main Usage
A slide designed to express company or business history and development process in chronological order. The 5-stage timeline structure clearly visualizes key milestones, technological innovations, and business expansion phases, effectively communicating your organization's growth trajectory and future vision to the audience.
-
How to Use
Replace the year badges (2030, 2028, 2026, 2024, 2022, 2000) with actual dates and input descriptive text for each stage. Adjust chart element colors and heights to comparatively represent achievements and scale across periods. The 2-slide format allows you to separate past-to-present and present-to-future timelines, or emphasize continuity with identical layouts.
-
Recommended For
Ideal for company profile presentations, business plans, and investment pitch decks where you need to explain company history or technology development. Particularly useful for startups presenting growth stages, manufacturing companies showcasing technological innovation, and aerospace, space, or energy sector projects presenting long-term progress.
-
Slide Structure
The 2-slide set features a title area (top left) and timeline area (center to right) on each slide. The timeline comprises 6 year badges with descriptive text input zones to the right of each badge. The left side displays a futuristic city illustration with star and moon icons symbolizing future vision.
Related Products
-
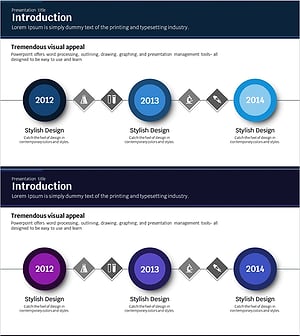
Scientific History Connection Diagram – Visualizing the Flow of Information
#Company Introduction #Diagram #History
-
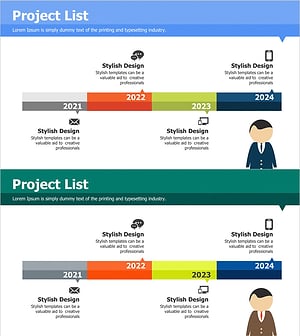
History Slide of the Service Development Company
#Company Introduction #Diagram #History
-
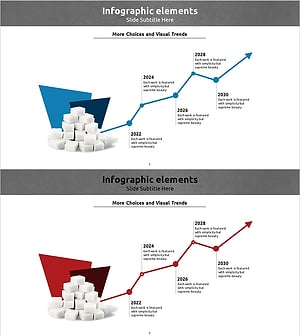
Line Graph of Sugar Intake by Year – Market Trends and Future
#Company Introduction #Market and Competitor Analysis #Graph
-
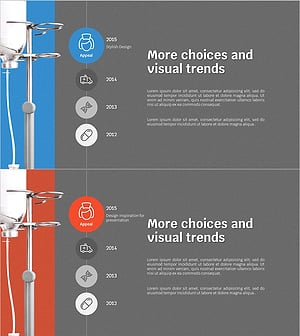
Medical Business History Diagram – Visual Representation of Chronology
#Company Introduction #Diagram #History