Medical Business History Diagram – Visual Representation of Chronology
RJ0400033_5
- Last Update 05/26/2025
- File Size 4.8MB
- # of Slides 2
- File Format PPTX
- Slide Ratio 16:9
- Color
Keywords
About the Product
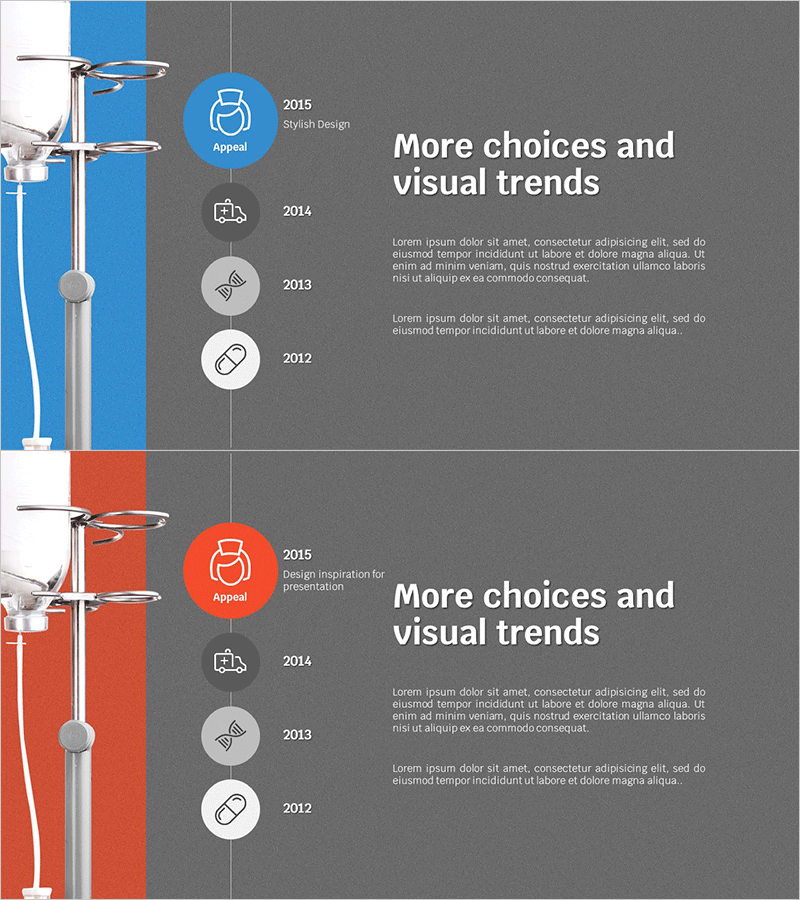
A vertical timeline diagram PowerPoint slide that visualizes the development history of medical business in chronological order. This 2-slide set provides blue and red color variations with a vertical timeline structure featuring 4 circular nodes connected by linking lines for clear chronological representation. Each node includes an icon and text area to effectively communicate key milestones such as company history, product launches, technological innovations, and business expansion. Available in 16:9 widescreen PPTX format for immediate editing and optimized for healthcare, pharmaceutical, and biotech industry presentations.
Usage Points
-
Main Usage
Visualizes the development process of medical business, company history, technological innovation stages, and product launch timelines in chronological order. The timeline structure helps audiences intuitively understand the company's growth trajectory and key milestones.
-
How to Use
Ideal for company history sections in corporate presentations, business achievement portions in investor pitch decks, healthcare institution introductions, pharmaceutical company technology development history, and medical research timeline presentations. Easily customize node text and icons to highlight specific milestones.
-
Recommended For
Healthcare, pharmaceutical, and biotech industry executives, marketing teams, business development professionals, investor relations managers, healthcare administrators, and academic presenters who need to communicate company history and growth trajectory persuasively.
-
Slide Structure
2-slide set with blue background version and red background version. Each slide features a vertical centerline timeline with 4 circular nodes alternately positioned left and right. Each node contains an icon, year/title text, and description area. Optimized in 16:9 widescreen format for modern presentation environments.
Related Products
-

Spade Shape Theme History Diagram – Emphasizing Company Development
#Company Introduction #Diagram #History
-

Business History Connection Diagram – Company Growth Story
#Company Introduction #Diagram #History
-

Fountain Pen History Diagram – Emphasizing Corporate Identity
#Company Introduction #Product/Service Introduction #Diagram
-

Silhouette History Diagram – Visualizing Evolution
#Company Introduction #Diagram #Other
