Writing Instrument Pie Diagram – Business Introduction Slide
RJ0500022_11
- Last Update 06/13/2025
- File Size 3.7MB
- # of Slides 2
- File Format PPTX
- Slide Ratio 16:9
- Color
Keywords
- #Content-Based Slides
- #Design-Based Slides
- #Company Introduction
- #Business Introduction
- #Diagram
- #Business Areas
- #Business Areas
- #Cluster
- #Chain Diagram
- #16:9
- #pie chart PowerPoint slide
- #4-segment circular diagram
- #business analysis presentation
- #ratio visualization slide
- #pie chart template download
About the Product
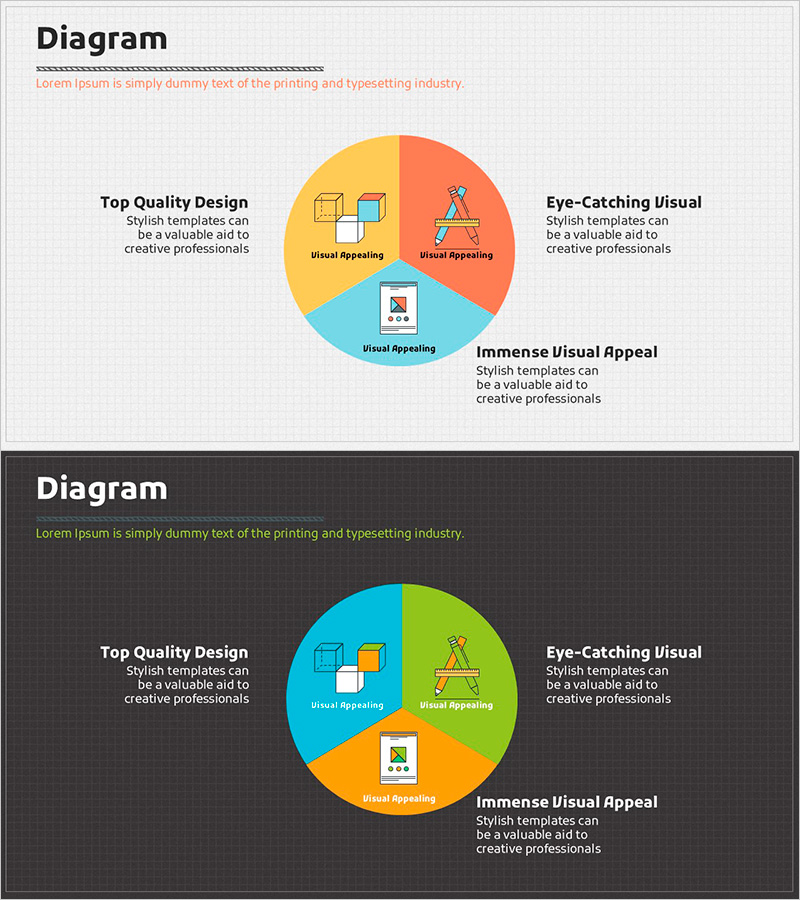
A professional pie chart PowerPoint slide optimized for business introductions and core element analysis. This presentation template features a 4-segment circular diagram with two background versions—light and dark—for flexible presentation environments. Each segment includes icons and descriptive text labels in distinct colors: orange, blue, yellow, and green for clear visual differentiation. The intuitive color-coded layout makes ratio and proportion analysis immediately understandable. Ready-to-use for business proposals, strategy presentations, and performance reports.
Usage Points
-
Main Usage
Visually communicate business composition, proportions, and relative importance of four key elements. The circular diagram format makes data-driven comparisons immediately clear to audiences. Ideal for strategy, marketing, and business overview presentations where proportion analysis strengthens persuasion.
-
How to Use
Replace section text and icons with your specific content. Maintain the existing color palette or customize with brand colors. Use the light background version for printed materials and PDF distribution; select the dark background for projector presentations. All elements are fully editable in PowerPoint.
-
Recommended For
Recommended for executives, business strategists, marketing professionals, and product managers presenting business overviews, product introductions, and market analysis. Suitable for investor pitch decks, business proposals, quarterly performance reports, and any data-driven corporate communication.
-
Slide Structure
Central pie chart divided into 4 color-coded segments with accompanying icons and labels. Descriptive text boxes positioned on left and right sides provide detailed information for each segment. Two background options (light and dark) accommodate various presentation settings and display technologies.
Related Products
-

Fountain Pen Business Area Diagram – Overview for Business Presentation
#Company Introduction #Business Introduction #Diagram
-

Diffusion Diagram with Center for Business Area Presentation
#Company Introduction #Business Introduction #Diagram
-

Business Area Overlay Diagram – A Blend of Visual Appeal and Functionality
#Company Introduction #Business Introduction #Diagram
-

Pentagonal Star Diagram – Cluster for Business Introduction
#Company Introduction #Business Introduction #Diagram
