Bar Graphs & Tables – New Dimension of Data Visualization
RJ0700006_19
- Last Update 07/23/2025
- File Size 2.5MB
- # of Slides 2
- File Format PPTX
- Slide Ratio 16:9
- Color
Keywords
- #Content-Based Slides
- #Design-Based Slides
- #Market and Competitor Analysis
- #Diagram
- #Graph
- #Competitor Analysis
- #Table
- #Horizontal Bar
- #Standard Table
- #Horizontal Bar Chart
- #16:9
- #horizontal bar chart PowerPoint
- #data visualization slides
- #comparison table template
- #market analysis presentation
- #competitive analysis PowerPoint
- #business data slide template
About the Product
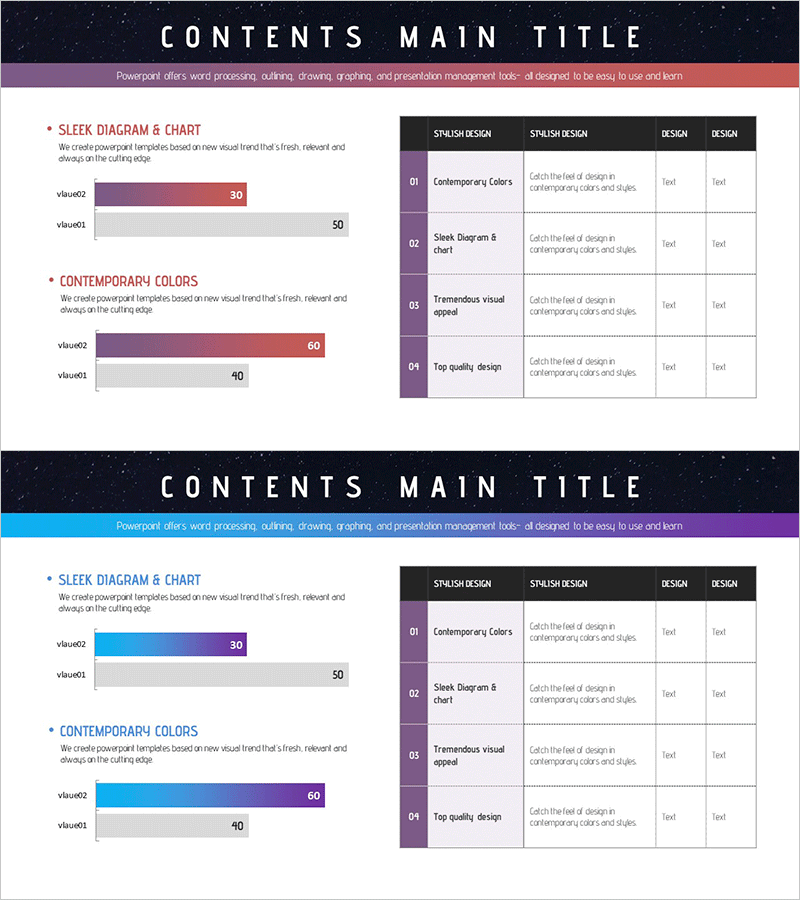
A professional PowerPoint slide set optimized for market analysis and competitive benchmarking. The 2-slide deck features a horizontal bar chart comparing two data items on the first slide, and a 4×4 information table on the second slide for detailed metrics. The muted purple and gray color palette conveys business credibility and analytical rigor. Ideal for executive reports, marketing strategy presentations, and market landscape analysis. Each slide is fully editable with placeholder text and data fields ready for your specific metrics and insights.
Usage Points
-
Main Usage
Visualize quantitative comparisons using horizontal bar charts while presenting detailed metrics in tabular format simultaneously. Effectively communicate market size, revenue, market share, and other KPIs to executives and stakeholders for informed decision-making.
-
How to Use
Enter comparison item names and values into the horizontal bar chart on slide 1. Populate the 4-column table on slide 2 with detailed data (item names, metrics, descriptions, ratings). Customize colors and fonts to match your corporate brand guidelines. Optimized for 16:9 widescreen display.
-
Recommended For
Ideal for executives, marketing teams, sales professionals, and strategic planners presenting quarterly results, market assessments, new business case studies, and client proposals. Perfect for data-driven presentations requiring side-by-side comparison and detailed supporting information.
-
Slide Structure
Slide 1: Horizontal bar chart with 2 data series, value labels, and legend. Slide 2: 4-row × 4-column information table (header row + 3 data rows, all cells editable). Dark navy header band with white content area; purple and gray accent colors throughout.
Related Products
-

Stylish Bar Chart Slide Design
#Market and Competitor Analysis #Diagram #Graph
-

Cement Theme Bar Graph & Table
#Market and Competitor Analysis #Diagram #Graph
-

Horizontal Bar Chart for Competitive Advantage Analysis – Sea Lighthouse
#Market and Competitor Analysis #Diagram #Graph
-

Sugar Content Analysis Bar Graph Table
#Market and Competitor Analysis #Diagram #Graph
