Astronomy Themed Radial Graph – A Visual Analysis Tool
RJ0700003_9
- Last Update 07/22/2025
- File Size 0.4MB
- # of Slides 2
- File Format PPTX
- Slide Ratio 16:9
- Color
Keywords
About the Product
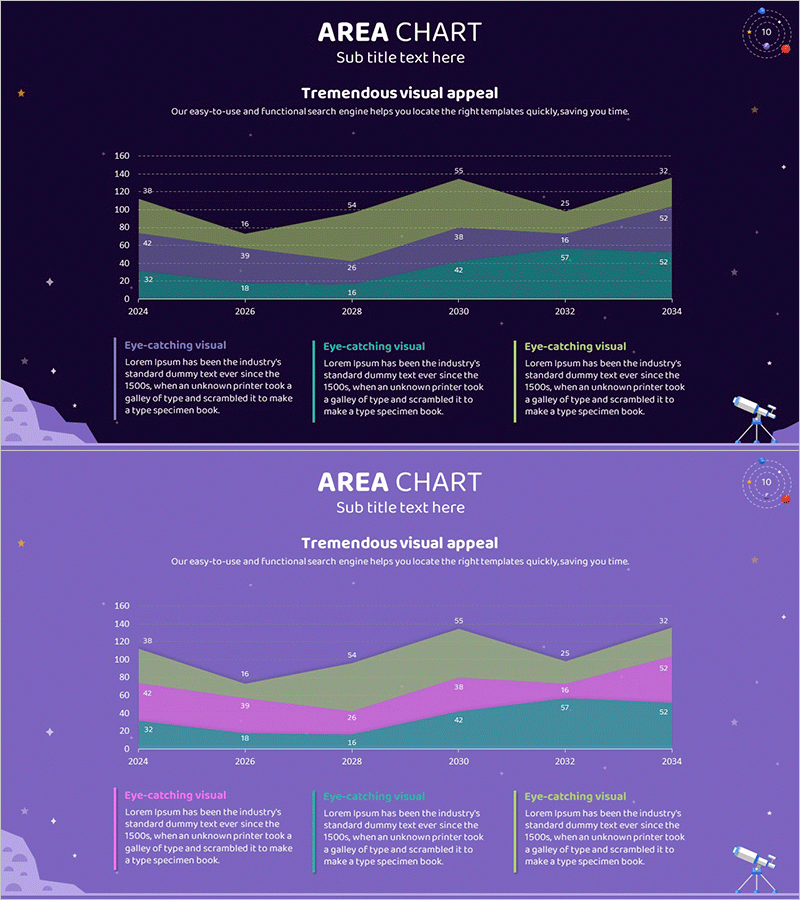
A stacked area chart PowerPoint slide optimized for market analysis and competitive landscape presentations. The dark navy background features four layered areas in green, purple, and teal tones, clearly displaying trends from 2024 to 2034. Numerical labels are positioned above each data point for precise reading, and three explanation boxes at the bottom allow for additional insights. This PPT design is ideal for presentations, reports, and investor materials where you need to compare complex multi-dimensional data at a glance.
Usage Points
-
Main Usage
This slide visualizes complex datasets such as market conditions, competitor market share, and revenue trends over time. The four stacked layers simultaneously show total scale and individual category proportions, making it highly effective for presenting decision-making evidence.
-
How to Use
Use this slide in market analysis, competitive analysis, and financial trend presentations. Customize each area color by category, replace numerical labels with actual data, and fill the bottom explanation boxes with key insights. It works best for displaying long-term trends spanning 10+ years.
-
Recommended For
Recommended for strategy planning teams, marketing departments, finance teams, and executive reports. Particularly useful when explaining market size changes, customer segment revenue composition, and competitor market share evolution. Applicable in investor pitch decks, business plans, and quarterly performance reports.
-
Slide Structure
Title area at top + central four-layer stacked area chart (X-axis: 2024–2034, Y-axis: 0–160) + numerical data labels at each point + three explanation boxes at bottom (each accommodates ~100 characters of text). The overall layout features balanced left-right and top-bottom margins, providing ample space for additional text or logo placement.
Related Products
-

Mobile Market Analysis Graph – Insights on Market Trends
#Market and Competitor Analysis #Diagram #Graph
-

VR Market Analysis Bar Graph – Understanding Competitive Landscape
#Market and Competitor Analysis #Graph #Competitor Analysis
-

Market Analysis 3D Graph – Visualizing Competitive Market Research
#Market and Competitor Analysis #Graph #Competitor Analysis
-

Data Analysis Bar Graph – Essential for Market and Competitor Analysis
#Market and Competitor Analysis #Graph #Competitor Analysis
