Orange Purple Table Chart - Visual Tool for Data Insights
RJ0700002_29
- Last Update 07/21/2025
- File Size 0.3MB
- # of Slides 2
- File Format PPTX
- Slide Ratio 16:9
- Color
Keywords
- #Content-Based Slides
- #Design-Based Slides
- #Technical Approach
- #Market and Competitor Analysis
- #Diagram
- #Research and Development
- #Market Analysis
- #Table
- #16:9
- #data table PowerPoint slide
- #comparison table template
- #market analysis data visualization
- #technical specification table slide
- #research report PPT
About the Product
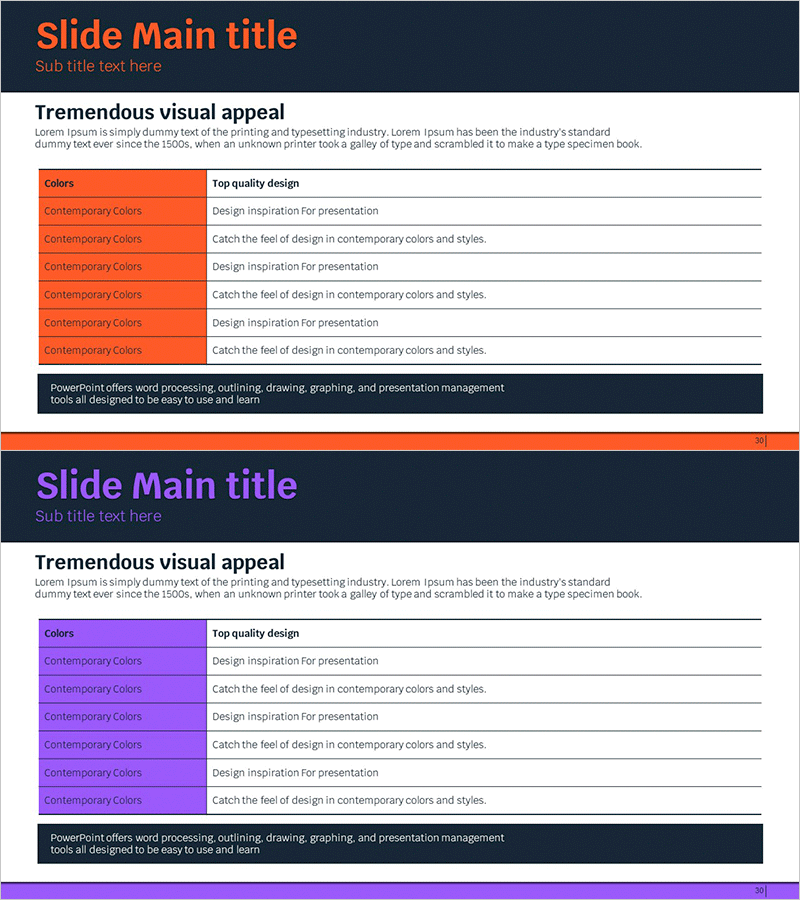
A 2-slide data visualization PowerPoint template optimized for market analysis, technology presentations, and R&D reports. Features a dual-tone header in orange and purple that clearly separates information hierarchy, with a 2-column layout combining left-side text area and right-side table section for simultaneous insight and data delivery. Each slide includes an editable 7-row, 2-column table structure ready for financial metrics, competitor comparisons, technical specifications, and other quantitative data. Provided in 16:9 widescreen PPTX format, this presentation slide is applicable to corporate presentations, reports, proposals, and all business documents requiring structured data visualization.
Usage Points
-
Main Usage
Visualizes quantitative data such as market conditions, competitor analysis, technical specifications, and financial metrics in a structured table format to clearly present decision-making evidence. The 2-column information structure—with key insights highlighted in the left text area and detailed data in the right table—enhances audience comprehension and data retention.
-
How to Use
Enter data directly into table cells or paste existing Excel tables into the slide. Write core conclusions or comparison points in the left text box while maintaining the orange and purple header colors for brand consistency. Customize by adding or removing rows and columns, or adjust colors to match your data scale and corporate identity.
-
Recommended For
Recommended for finance teams presenting income statements and budget analysis, marketing teams comparing market share and competitors, technology teams showcasing system specifications and performance benchmarks, and executives presenting KPI dashboards. Particularly effective for IR materials, business reports, and technical proposals where quantitative evidence strengthens credibility.
-
Slide Structure
2-slide set with each slide featuring a dark header (orange or purple), left-side text input area (title and description ~200 characters), and right-side 7-row, 2-column editable table. The table header row is highlighted in the corresponding color, while data rows use white background for readability. Footer area provides space for additional notes or source attribution.
Related Products
-

Chemical Experiment Analysis Graph Chart – Visualizing R&D Achievements
#Technical Approach #Market and Competitor Analysis #Diagram
-

Scientific Experiment Results Analysis Graph – Visualizing Research Outcomes
#Technical Approach #Market and Competitor Analysis #Diagram
-

Graph Charts for Systematic Market Analysis – Bar and Pie Charts
#Technical Approach #Market and Competitor Analysis #Diagram
-

Development Status Analysis Chart - Visualization for Effective Market Analysis
#Product/Service Introduction #Market and Competitor Analysis #Diagram
