Purple Green Donuts Chart Analysis
RJ0600108_15
- Last Update 07/20/2025
- File Size 0.8MB
- # of Slides 2
- File Format PPTX
- Slide Ratio 16:9
- Color
Keywords
About the Product
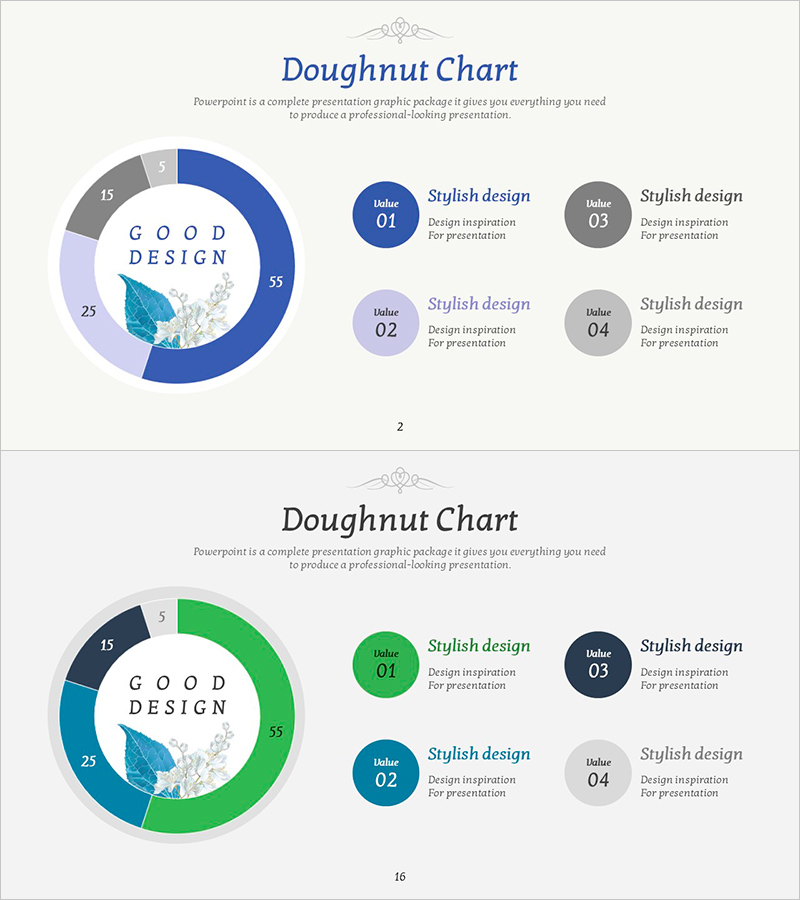
A doughnut chart PowerPoint slide that intuitively expresses data proportions and composition ratios. The design features a central message area surrounded by a four-segment donut graph in purple, green, blue, and gray tones, with numeric labels and legend for clear category distinction. Ideal for business reports, presentations, and marketing plans requiring visual data representation. The 2-slide set accommodates various analytical scenarios and supports immediate customization for different datasets.
Usage Points
-
Main Usage
Optimized for expressing data composition ratios and percentage distribution across categories using a donut graph format. The central text area accommodates key messages or aggregate figures, while four distinct color segments enable intuitive category differentiation and visual emphasis.
-
How to Use
Apply to business reports for market share, revenue composition, or customer distribution analysis. Use in marketing presentations to illustrate target audience segments or channel-based revenue breakdown. Ideal for investor pitch decks explaining business portfolio composition or revenue diversification, and strategic presentations visualizing resource allocation by priority.
-
Recommended For
Finance, marketing, and strategy professionals presenting quantitative data to executives, investors, or stakeholders. Effective for quarterly performance reports, new business portfolio analysis, customer segmentation studies, and channel performance comparisons where ratio-based decision-making is essential.
-
Slide Structure
Two-slide set with consistent layout: central donut chart surrounded by 'Good Design' text and decorative elements. Slide 1 uses purple, lavender, gray, and light blue segments; Slide 2 features green, teal, gray, and dark navy segments—both maintaining 4-segment structure for flexible multi-dataset representation.
Related Products
-

Country-by-country Status Analysis Map Template
#Company Introduction #Graph #Other
-

User Analysis Bar Graph – Providing Customer Insights
#Market and Competitor Analysis #Graph #Customer Analysis
-

Soccer Game Illustration Graph for Market and Competitive Analysis
#Business Strategy #Market and Competitor Analysis #Graph
-

User Analysis Graph by Age Group – Advanced Data Insights
#Market and Competitor Analysis #Diagram #Graph
