Analyzing Purple Green Market Trends – Bar and Column Charts
RJ0600108_12
- Last Update 07/20/2025
- File Size 0.1MB
- # of Slides 2
- File Format PPTX
- Slide Ratio 16:9
- Color
Keywords
About the Product
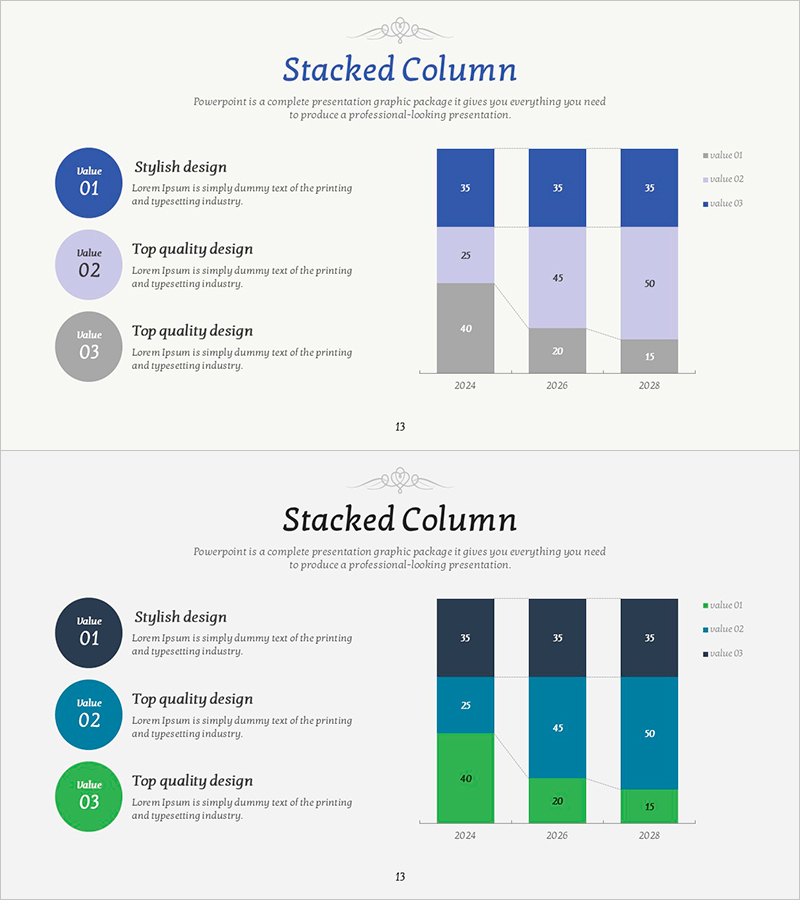
A stacked column chart PowerPoint slide designed for market trend analysis spanning 2024 to 2028 with three data series. The 2-slide template features contrasting purple and green color palettes that clearly differentiate each data series. The left section includes three analytical labels with descriptive text, while the right side displays a stacked bar chart with numerical values for intuitive data visualization. Ideal for competitive analysis, market share comparison, and revenue trend presentations. Ready to use in business reports, investor pitches, and executive briefings.
Usage Points
-
Main Usage
Compare market trends across three data series over multiple years using stacked column visualization. The chart simultaneously displays total volume and series composition for each year, enabling quick identification of trends and structural changes.
-
How to Use
Edit the left-side labels to match your analysis points and update the chart values with actual data. The template is optimized for 16:9 widescreen format, and color schemes can be adjusted to match corporate branding guidelines.
-
Recommended For
Marketing plans, business reports, investor presentations, and executive briefings requiring market size, share, or growth rate analysis. Suitable for sales teams, planning departments, and C-level presentations.
-
Slide Structure
Slide 1: Three data series (purple, lavender, gray tones) displayed as stacked columns across three years (2024, 2026, 2028) with numerical labels inside each segment. Slide 2: Identical structure with dark blue, turquoise, and green color scheme for alternative color selection.
Related Products
-

Key Messages on a Vertical Cumulative Chart
#Business Vision and Strategy #Market and Competitor Analysis #Diagram
-

Farm Subdivision Vertical Bar Graph – Market Trend Analysis
#Market and Competitor Analysis #Graph #Market Status
-

Building Market Vertical Accumulation Chart
#Market and Competitor Analysis #Graph #Industry Trends
-

Analyzing Future Prospect Graphs
#Market and Competitor Analysis #Diagram #Graph
