Snowboard Chart for Performance Visualization – Business Innovation
RJ0600107_9
- Last Update 07/20/2025
- File Size 0.8MB
- # of Slides 2
- File Format PPTX
- Slide Ratio 16:9
- Color
Keywords
About the Product
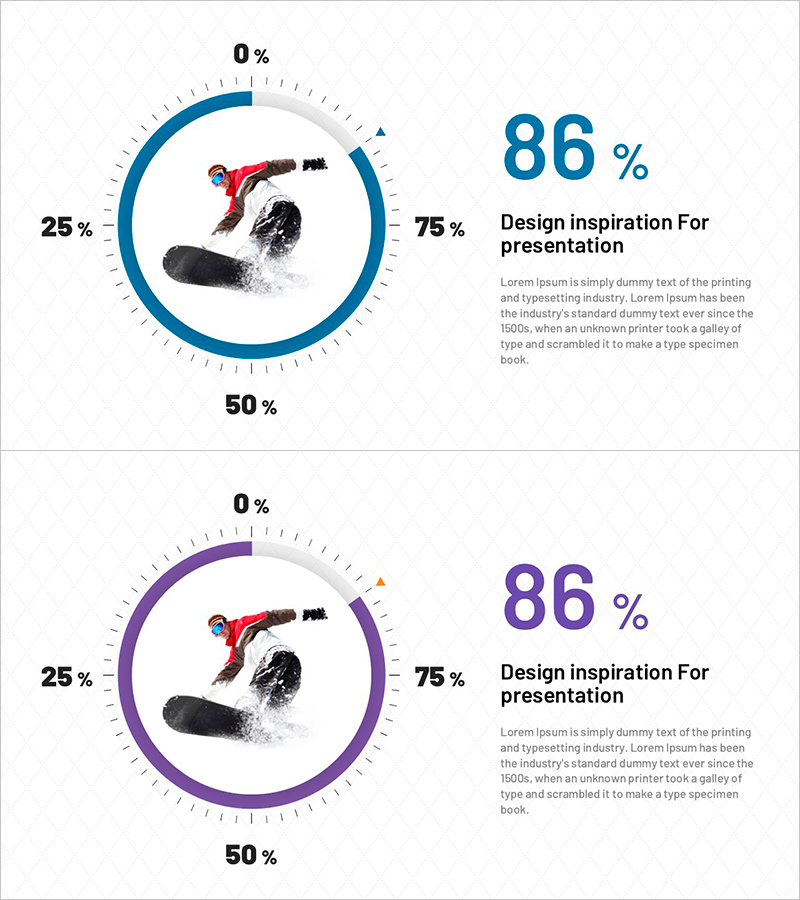
A donut-shaped pie chart PowerPoint slide with a central image insertion area for impactful data visualization. Provided in two color versions—blue and purple—to represent progress from 0% to 100%. Ideal for business performance reports, project status updates, and goal achievement metrics. The 16:9 widescreen PPTX format allows instant editing and customization of percentages and descriptive text. The circular design with percentage markers creates an intuitive visual hierarchy for audience engagement.
Usage Points
-
Main Usage
Visualize goal achievement rates, project completion percentages, and key performance indicators using a donut chart format. The central image area allows you to reinforce data context by adding relevant photos, icons, or logos that support your narrative.
-
How to Use
Deploy in executive dashboards, quarterly performance presentations, project status meetings, and marketing campaign result analyses. Select blue for conveying stability and trust, or purple for emphasizing innovation and creativity. Customize the percentage values and surrounding text to match your specific metrics.
-
Recommended For
Executives, project managers, marketing professionals, sales leaders, and consultants presenting quantitative results. Particularly effective when emphasizing goal-versus-achievement comparisons or highlighting milestone completion rates.
-
Slide Structure
Two-slide set featuring blue and purple color variants. Each slide includes a central circular image insertion zone, top-positioned percentage display (86%), side-positioned percentage markers (0%, 25%, 50%, 75%), and a right-aligned text area for title and description content.
Related Products
-

Comparison Bar Graphs and Core Doughnut Charts – Performance Analysis
#Business Introduction #Business Strategy #Graph
-

Market Share Analysis with Donut Chart and Box Icon
#Business Strategy #Market and Competitor Analysis #Graph
-

Donut Chart Analysis by Academic Content – Performance-Based Strategy
#Business Strategy #Diagram #Graph
-

Academic and System Donut Charts – Market Share Analysis
#Business Strategy #Market and Competitor Analysis #Graph
