Camp Schedule – Clear Schedule with Diagrams
RJ0600107_28
- Last Update 07/20/2025
- File Size 0.4MB
- # of Slides 2
- File Format PPTX
- Slide Ratio 16:9
- Color
Keywords
About the Product
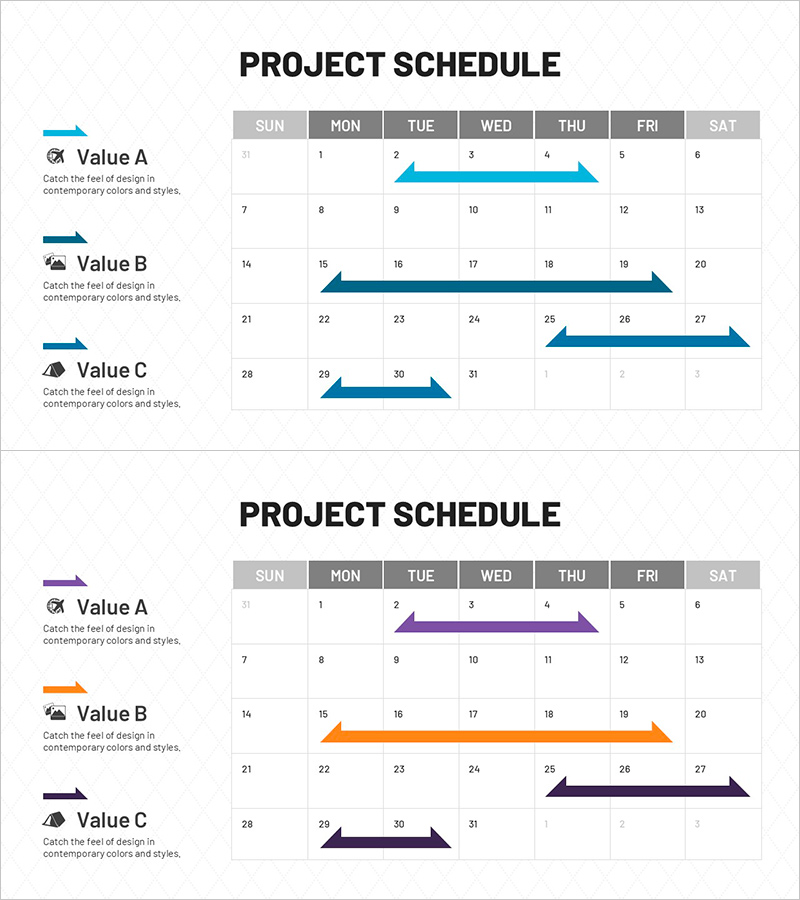
A PowerPoint slide featuring arrow-based timeline diagrams for clearly visualizing project schedules and timelines. This 2-slide set includes three color versions—blue, purple, and orange—allowing you to match your presentation theme and audience. Each slide combines a legend area on the left with a calendar grid on the right, using arrow shapes to indicate project duration from start to end date. Ideal for business plans, marketing campaigns, event planning, and project management presentations that require clear schedule visualization and timeline communication.
Usage Points
-
Main Usage
Visualize project timelines, marketing campaign schedules, and event planning on a calendar format to communicate clearly with team members and stakeholders. Arrow shapes highlight start and end dates, enabling quick comprehension of each phase duration at a glance.
-
How to Use
Enter project names or task items in the left legend, then place arrow shapes on the corresponding dates in the calendar grid to indicate duration. Switch between color versions to match your presentation theme or company branding, and duplicate slides to manage multiple concurrent projects.
-
Recommended For
Project managers, marketing professionals, event planners, and executives preparing status reports. Suitable for business plans, marketing proposals, project pitches, quarterly business reviews, and timeline-focused presentation sections.
-
Slide Structure
2-slide set. Each slide features a title area at the top, a left legend with 3 items (icon + text), and a right calendar grid (7 columns × 7 rows). Arrow shapes positioned above the calendar cells correspond to each legend item, indicating project duration across the calendar dates.
Related Products
-

Business Forest Wide Diagram Template
#Business Vision and Strategy #Diagram #Business Strategy
-

Travel guide business step-by-step itinerary planning connection diagram
#Business Strategy #Diagram #Step-by-Step Schedule Plan
-

Step-by-step Schedule Diagram – Flow of Business Strategy
#Business Strategy #Operational Plan #Diagram
-

Table Chart on Competition and Communication - Market and Customer Analysis
#Market and Competitor Analysis #Diagram #Customer Analysis
