Itinerary Doughnut Graph – Efficient Planning
RJ0600106_5
- Last Update 07/19/2025
- File Size 2.3MB
- # of Slides 2
- File Format PPTX
- Slide Ratio 16:9
- Color
Keywords
- #Content-Based Slides
- #Design-Based Slides
- #Business Management
- #Market and Competitor Analysis
- #Diagram
- #Graph
- #Execution Plan
- #Market Share
- #Cluster
- #Circles
- #Chain Diagram
- #Doughnut Chart
- #16:9
- #doughnut chart PowerPoint
- #pie chart slide template
- #3-segment donut graph
- #travel itinerary visualization
- #ratio chart PPT
About the Product
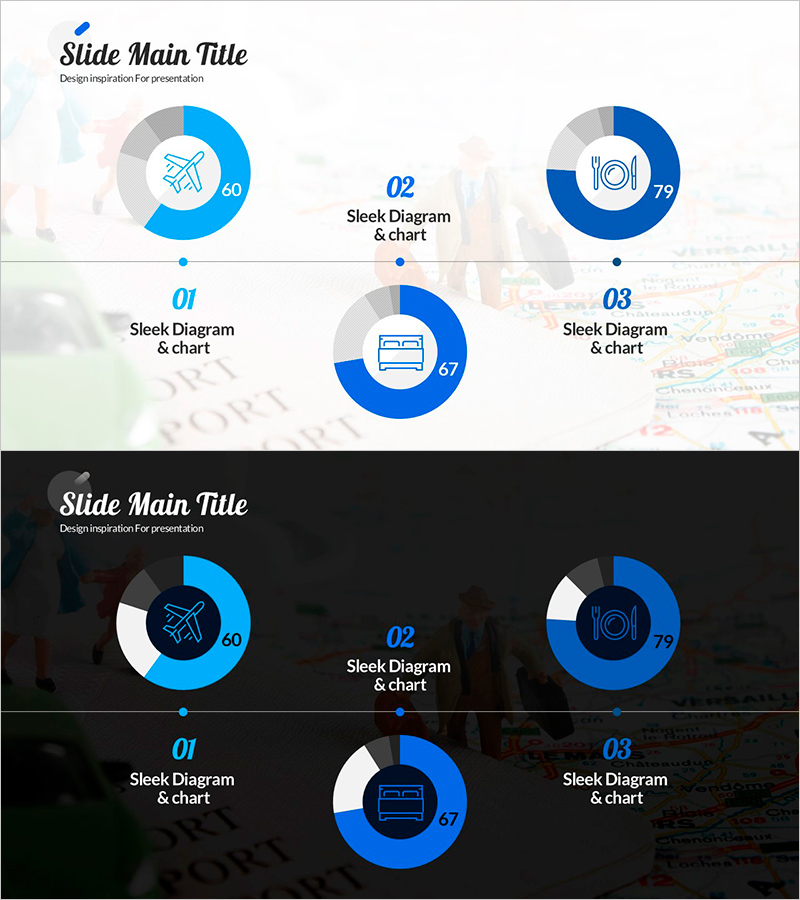
A three-segment doughnut chart PowerPoint slide designed to visualize travel itinerary planning and time allocation across different journey phases. The circular chart features a three-tone color scheme—light gray, medium blue, and dark blue—enabling clear comparison of travel duration by segment, budget distribution, and activity proportions. The center circular area accommodates icons and numerical values to emphasize key information for each segment, while the lower section provides space for detailed descriptions. The 2-slide set includes both light and dark background versions, adapting to various presentation environments. Ideal for travel agencies, tourism marketing, event planning, and project management to effectively communicate proportional data.
Usage Points
-
Main Usage
Display travel time allocation, budget distribution, and activity composition ratios using a doughnut chart for immediate audience comprehension. Center icon areas highlight key information for each segment, enhancing data clarity and engagement.
-
How to Use
Apply to travel planning presentations, tourism product introductions, event scheduling explanations, and project progress reports where proportional data visualization is required. Easily edit numerical values and labels to customize the chart for various data sets.
-
Recommended For
Travel agencies, tourism boards, airlines, hotel marketing teams, event and conference planners, project managers, business plan presenters, and marketing professionals requiring visual representation of proportional data.
-
Slide Structure
Two slides featuring a three-segment doughnut chart with distinct color coding (light gray, medium blue, dark blue). Each segment includes a center icon and numerical input area. Light background and dark background versions provided for flexible presentation environment adaptation.
Related Products
-

Development Status Analysis Connection Diagram – Effective Information Delivery
#Product/Service Introduction #Market and Competitor Analysis #Diagram
-

Status of Research and Development by Topic – Innovation and Trust
#Product/Service Introduction #Market and Competitor Analysis #Diagram
-

The Proportion and Characteristics of Composed Flowers – Engaging Infographic Slide
#Product/Service Introduction #Market and Competitor Analysis #Diagram
-

Visualizing Market Share with Plus Donut Chart
#Market and Competitor Analysis #Diagram #Graph
