Colorful Vertical Bar Chart for Data Visualization – A Template with Practicality and Creativity
RJ0600105_6
- Last Update 07/19/2025
- File Size 7MB
- # of Slides 2
- File Format PPTX
- Slide Ratio 16:9
- Color
Keywords
About the Product
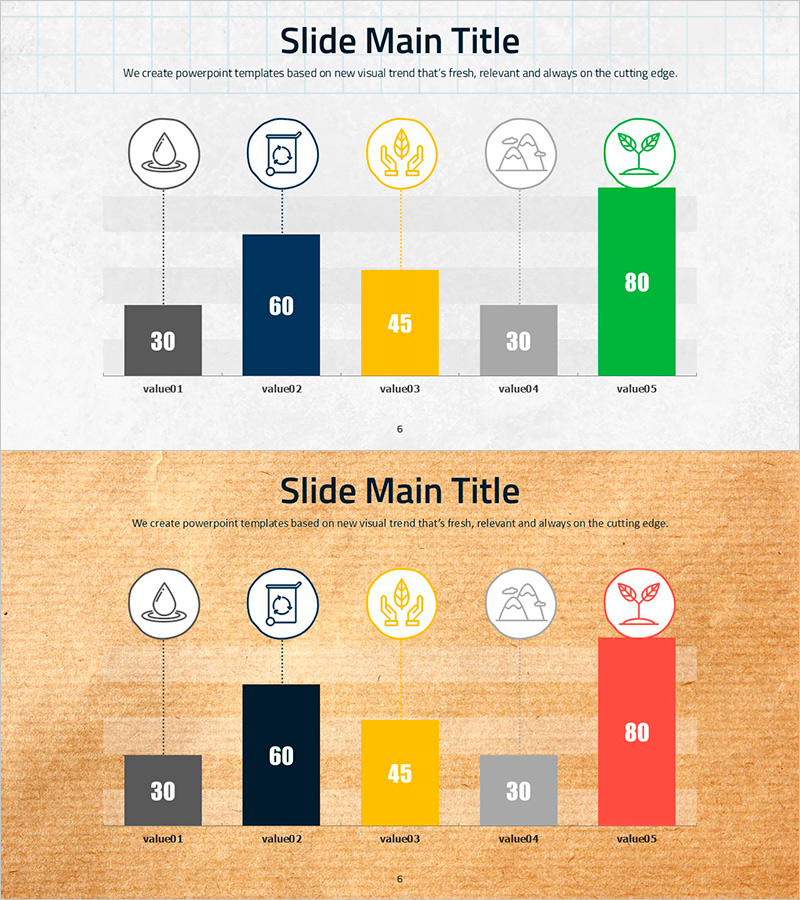
A vertical bar chart PowerPoint slide comparing five data values with icon-linked categories. Each bar is topped with a circular icon for visual distinction, and the bars are colored in gray, navy blue, yellow, and green to represent different data categories or importance levels. The 2-slide set includes a light background version and a warm orange background version, allowing you to match your presentation tone. Ideal for business reports, sales performance analysis, achievement comparisons, and other quantitative data visualization in professional presentations.
Usage Points
-
Main Usage
Visualize quantitative data through bar height to enable intuitive comparison and clearly show relative size differences between items. Commonly used for business performance, sales volume, customer satisfaction, market share, and other multi-item numerical data in decision-making materials.
-
How to Use
Adjust each bar height to match your actual data values and replace icons and labels with your category names. Use the light background version for bright-toned presentations and the orange background version for warm-toned slides to maintain design consistency throughout your deck.
-
Recommended For
Financial reports, marketing analysis, business plans, quarterly performance presentations, market research results, product comparison analysis, and other data-driven presentations for executives, analysts, marketers, and consultants.
-
Slide Structure
Composed of 5 vertical bars with circular icons (water drop, document, grain, mountain, plant) positioned above each bar. Bar colors vary by item, with category names (value01–value05) and numerical values displayed at the bottom. Both slides share identical structure with different background colors.
Related Products
-

Current Status of School Violence from Data – Utilizing Bar Graphs
#Market and Competitor Analysis #Graph #Market Analysis
-

User Analysis Graph by Age Group – Advanced Data Insights
#Market and Competitor Analysis #Diagram #Graph
-

Analyzing Market Share with 3 Donut Charts and Tables
#Market and Competitor Analysis #Diagram #Graph
-

Analyze Sales Performance with Geometric Pattern Wide Bar Chart
#Market and Competitor Analysis #Financial Plans and Performance #Graph
