Eco-friendly Horizontal Bar Graph for Market Overview
RJ0600103_27
- Last Update 07/19/2025
- File Size 1.2MB
- # of Slides 2
- File Format PPTX
- Slide Ratio 16:9
- Color
Keywords
About the Product
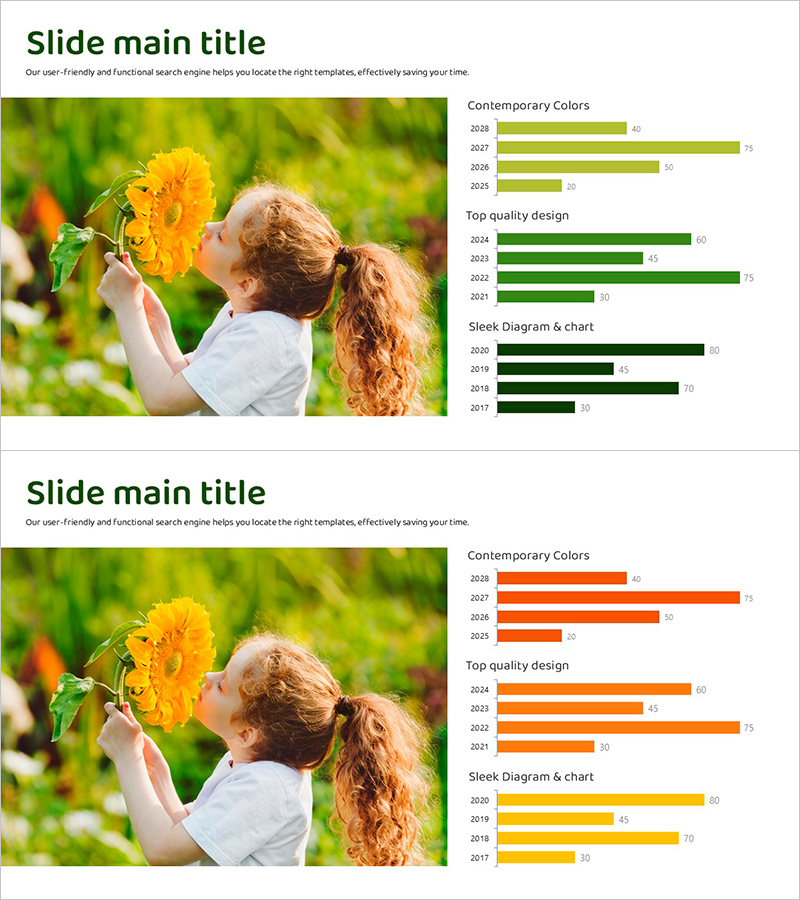
A PowerPoint slide featuring eco-friendly horizontal bar charts that clearly visualize market trends and performance data. The slide set uses green and orange color palettes across three chart sections (Contemporary Colors, Top quality design, Sleek Diagram & chart) to compare 4-year data trends at a glance. Delivered as 2 slides in 16:9 widescreen format, ready for immediate use in presentations, reports, and business analysis materials. Each bar includes numerical labels for precise data communication, and the eco-friendly color scheme is particularly effective for sustainability-focused presentations and corporate reports.
Usage Points
-
Main Usage
This slide visualizes numerical data such as market conditions, sales performance, and year-over-year results using horizontal bar charts. It simultaneously displays changes across three categories (color trends, design quality, diagram efficiency) over multiple years, making it ideal for complex data comparisons.
-
How to Use
Insert into business reports, marketing analysis presentations, or market research slides where year-over-year performance comparison is needed. Use as a key metrics page in executive briefing materials. Edit the bar values with actual data and deploy immediately as presentation content.
-
Recommended For
Marketing professionals, executives, data analysts, and consultants presenting market trends, sales trajectories, and performance metrics. Highly suitable for sustainability-focused companies, ESG reports, and environmental impact presentations.
-
Slide Structure
Two-slide set with each slide divided into left image area and right section containing three horizontal bar charts. Each section displays bars for 4 years (2028·2027·2026·2025 or 2024·2023·2022·2021·2020·2019·2018·2017) with numerical labels positioned on the right side of each bar.
Related Products
-

Sports Analysis Bar Chart – Easy Performance Monitoring Option
#Business Strategy #Market and Competitor Analysis #Graph
-

Business Future Outlook Analysis Chart
#Market and Competitor Analysis #Graph #Market Status
-

Children’s Activity Preferences Comparison – Market Status and Competitive Advantage
#Market and Competitor Analysis #Graph #Market Status
-

Plastic Waste Emission PowerPoint Slide – Donut Chart
#Market and Competitor Analysis #Graph #Market Status
