Arrow Map to Illustrate Distribution Strategy - Market Analysis
RJ0600102_24
- Last Update 07/18/2025
- File Size 1.2MB
- # of Slides 2
- File Format PPTX
- Slide Ratio 16:9
- Color
Keywords
- #Content-Based Slides
- #Design-Based Slides
- #Market and Competitor Analysis
- #Marketing Plan and Strategy
- #Diagram
- #Market Analysis
- #Distribution Strategy
- #Flow
- #Cluster
- #Linear Flow
- #Chain Diagram
- #16:9
- #world map PowerPoint slide
- #global network diagram
- #distribution strategy presentation
- #market analysis slide
- #map-based PowerPoint template
- #how to create world map diagram in PowerPoint
About the Product
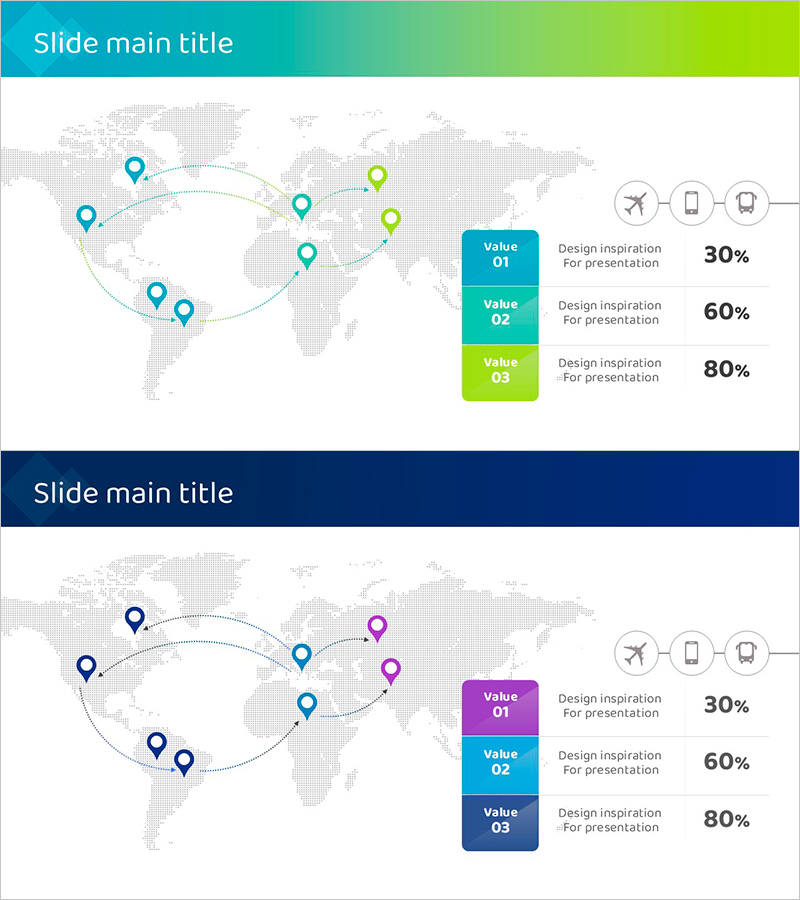
A PowerPoint slide that visualizes global distribution strategy and market analysis using 8 location nodes and connecting arrows on a world map. The design features a turquoise-to-lime gradient header and gray map background with turquoise and lime pin markers representing international business flows intuitively. The 2-slide set includes the first slide in turquoise-lime tones and the second in purple-turquoise-navy tones, adapting to various presentation scenarios. A legend on the right displays 3 data items with percentage values for regional performance comparison. Provided in fully editable PPTX format for immediate customization.
Usage Points
-
Main Usage
Illustrates global business strategy, international distribution networks, and regional market analysis through map-based node connections. Eight location markers and curved arrows enable viewers to grasp regional flows, relationships, and networks at a glance, while the right-side legend with 3-tier data simultaneously communicates regional performance comparisons.
-
How to Use
Use in executive reports, investor presentations, and marketing strategy pitches to explain global expansion strategies or international supply chains. Customize node positions, arrow directions, and legend values to match your data, visualizing regional sales volumes, market share, or distribution channel composition.
-
Recommended For
International business managers, marketing strategy teams, executive report writers, investor relations professionals, and regional expansion project leaders. Particularly suited for multinational corporations presenting global strategy development, regional performance analysis, and international partnership proposals.
-
Slide Structure
2-slide set. Each slide comprises a gradient header at the top (slide title area), gray world map in the center, 8 location pin markers (turquoise and lime colors), curved connecting arrows, and a right-side legend (3 items + percentage data). First slide in turquoise-lime tones; second slide in purple-turquoise-navy tones for color variation.
Related Products
-

Diagram Slide for Ship Operating System
#Business Strategy #Operational Plan #Marketing Plan and Strategy
-

Food Truck Connection Diagram - Operations and Marketing Strategy
#Operational Plan #Marketing Plan and Strategy #Diagram
-

Flow Diagram for Key Takeaway Summary
#Business Strategy #Business Management #Diagram
-

Modern Business Background and Necessity – Slide Illustrating Business Strategy Flow
#Business Vision and Strategy #Business Strategy #Diagram
