Natural Environmental Analysis Table Slide – Data and Evolution
RJ0600099_18
- Last Update 07/17/2025
- File Size 4.4MB
- # of Slides 2
- File Format PPTX
- Slide Ratio 16:9
- Color
Keywords
About the Product
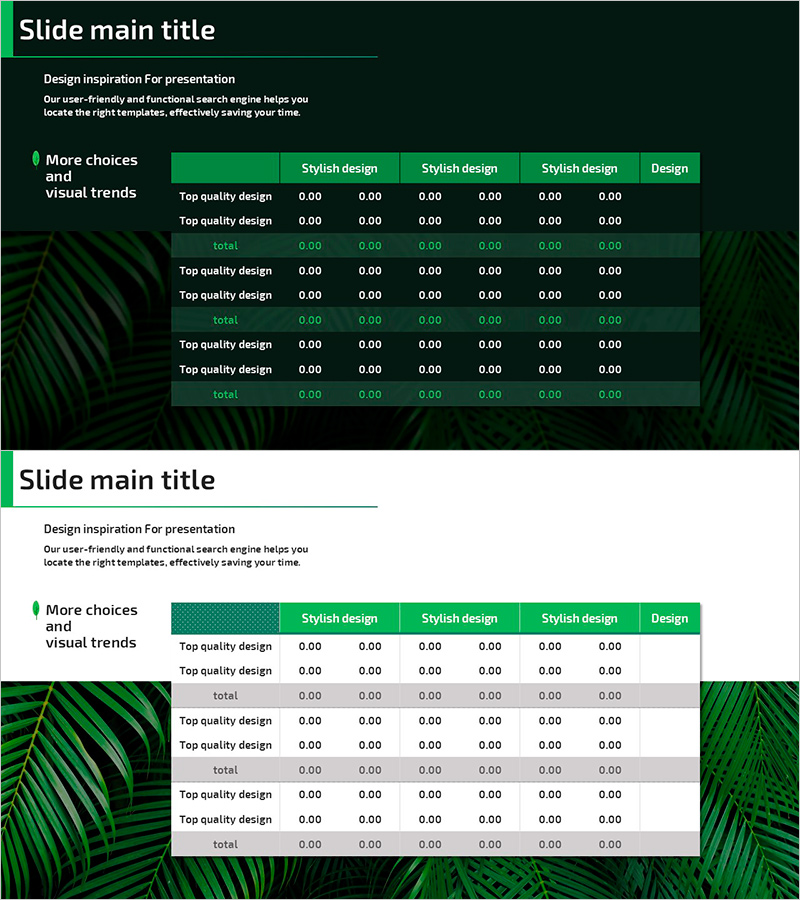
A 6-column data comparison table PowerPoint slide optimized for environmental analysis and data visualization. Featuring a dark green background with bright green header rows, this presentation template clearly organizes information with 'Stylish Design' and 'Top Quality Design' categories across columns. Composed of 2 slides in 16:9 widescreen PPTX format, it enables systematic presentation of environmental data, evolutionary processes, comparative analysis, and quantitative information. The nature-friendly green color scheme creates a professional atmosphere ideal for sustainability, ecology, and environmental impact presentations.
Usage Points
-
Main Usage
Present quantitative environmental data, ecological statistics, evolutionary trends, and comparative analysis in a structured, visually organized format. The green color palette reinforces credibility and professionalism for sustainability, environmental science, and ecology-focused presentations.
-
How to Use
Enter analysis categories (e.g., region, species, population count, change rate) in column headers and input specific data values and descriptions in rows. Maintain visual consistency with the green background while adjusting text color and font size to emphasize information hierarchy and key metrics.
-
Recommended For
Environmental scientists, ecology researchers, sustainability officers, environmental policy makers, conservation organization staff, environmental education instructors, corporate ESG reporting, environmental impact assessment presentations, climate change initiatives, and biodiversity research communications.
-
Slide Structure
2-slide layout with multi-column table structure. Each slide contains 6 columns and multiple data rows. Header row highlighted in bright green; data rows displayed on dark green background with white text. Each cell is independently editable. Subtotal (total) rows separate data sections and provide clear data grouping for comparative analysis.
Related Products
-

Space Industry Schedule Planning Chart – Future of Space Development
#Business Management #Operational Plan #Diagram
-

Blue Pink Circle Graph & Table Chart – Slide Highlighting Visual Appeal
#Product/Service Introduction #Operational Plan #Technical Approach
-

Spring Background Table – Visualizing Financial Performance!
#Financial Plans and Performance #Diagram #Cash Flow Statement
-

Summer Template Planning Table Chart – Optimizing Business Management and Operations
#Business Management #Operational Plan #Diagram
