Current Status and Prospects of Cultivation – Market Analysis Graph
RJ0600097_13
- Last Update 07/17/2025
- File Size 2MB
- # of Slides 2
- File Format PPTX
- Slide Ratio 16:9
- Color
Keywords
About the Product
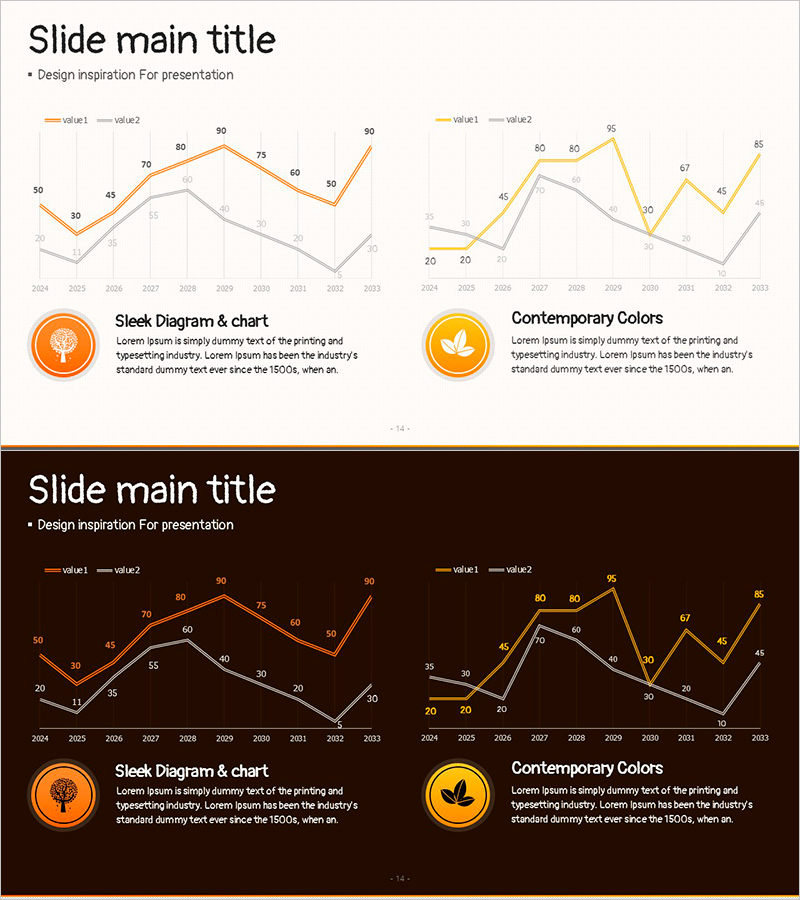
A dual-series line chart PowerPoint slide that compares data changes over time from 2024 to 2033. Orange and yellow lines clearly distinguish two separate data sets, making trend analysis intuitive and professional. Two design versions are included: a light background layout for standard presentations and a dark background layout for executive briefings. This slide template is ready to use for market analysis, cultivation status reports, sales forecasting, and any presentation requiring quantitative data comparison.
Usage Points
-
Main Usage
Visualize and compare two data series over time to reveal trends, patterns, and performance gaps. Ideal for presenting market share evolution, cultivation area changes, sales performance comparisons, or any longitudinal data analysis requiring side-by-side trend evaluation.
-
How to Use
Replace the sample data values (30–90 range) with your actual figures. The light version suits routine reports and team meetings, while the dark version works best for C-suite presentations and formal business reviews. Customize axis labels and legend text to match your presentation context.
-
Recommended For
Marketing professionals presenting market analysis, sales teams reporting performance trends, business planners forecasting growth, research teams sharing data findings, and operations managers comparing regional or departmental metrics. Suitable for competitive analysis, year-over-year performance reviews, and multi-period forecasting.
-
Slide Structure
Each slide contains two line charts side by side. The left chart displays a 10-year trend (2024–2033) with two data series, while the right chart shows an alternative data comparison for the same period. Orange and yellow lines are distinctly color-coded, with data point values labeled for precise reference and easy audience comprehension.
Related Products
-

Trend Color Wide Template Line Chart – Market Trend Analysis
#Market and Competitor Analysis #Graph #Future Outlook
-

Market Trends and Competitor Analysis Chart – Emphasizing Future Outlook
#Market and Competitor Analysis #Graph #Future Outlook
-

Line Graph for Market Trend Analysis – Insights for Education
#Market and Competitor Analysis #Graph #Future Outlook
-

Online Presentation Template Line Chart – Market Trends and Visualization
#Market and Competitor Analysis #Graph #Future Outlook
