How to Make Tea - Efficient Operational Strategy Diagram Slide
RJ0800032_18
- Last Update 08/08/2025
- File Size 3.2MB
- # of Slides 2
- File Format PPTX
- Slide Ratio 16:9
- Color
Keywords
- #Content-Based Slides
- #Design-Based Slides
- #Business Strategy
- #Operational Plan
- #Diagram
- #Production Plan
- #Production and Technology Development Strategy
- #Cluster
- #Closed Cluster Diagram
- #16:9
- #cluster diagram PowerPoint
- #closed cluster diagram slide
- #3-node interconnection slide
- #process diagram PowerPoint
- #operational strategy diagram
About the Product
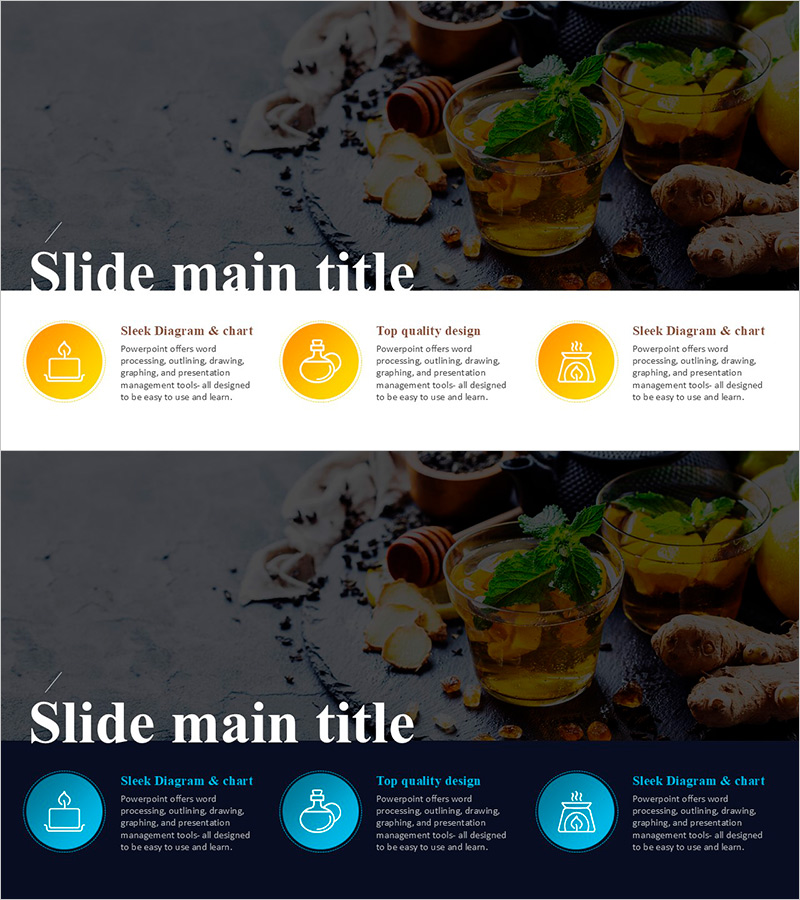
A closed cluster diagram PowerPoint slide that visualizes tea manufacturing processes and operational strategies. Three circular icon nodes are positioned around a central concept, clearly expressing interconnected relationships. Available in two color versions—orange and blue—allowing you to match your presentation context and brand tone. Each node includes an icon and text area for intuitively explaining manufacturing stages, quality control, and efficiency improvements. Comprises 2 slides optimized for 16:9 widescreen format.
Usage Points
-
Main Usage
Optimized for expressing interconnected relationships in manufacturing and production processes. Three core elements arranged around a central concept in a closed structure clearly visualize cyclic relationships and interdependencies. Enables at-a-glance understanding of multi-layered relationships such as operational strategies, quality management, and efficiency improvements.
-
How to Use
Modify the icons and text in each circular node to represent manufacturing stages, management items, or strategic elements. The orange version suits warm and approachable presentations, while the blue version works well for professional business presentations requiring credibility. Colors, text, and icons are fully customizable.
-
Recommended For
Recommended for manufacturing and food industry business plans, operational efficiency reports, quality management presentations, and process improvement proposals. Ideal for production managers, operations specialists, and project leaders explaining process interconnections.
-
Slide Structure
2-slide composition. Each slide features a background image (tea-related items) and a 3-node closed cluster diagram. Nodes consist of circular icons plus text areas, with connecting lines expressing relationships. Optimized for 16:9 widescreen format.
Related Products
-

Watercolor Marketing Goals Diagram
#Business Strategy #Operational Plan #Diagram
-

Food Rounding Description Box – Business Strategy
#Business Strategy #Operational Plan #Diagram
-

New Juice Production Plan Presentation Template
#Business Strategy #Operational Plan #Diagram
-

Diagram of Agricultural Process – Operational Planning through Cyclic Flow
#Business Strategy #Operational Plan #Diagram
