Sea Activity Radar Chart – Evolving Marine Exploration
RJ0600092_13
- Last Update 07/15/2025
- File Size 1.1MB
- # of Slides 2
- File Format PPTX
- Slide Ratio 16:9
- Color
Keywords
About the Product
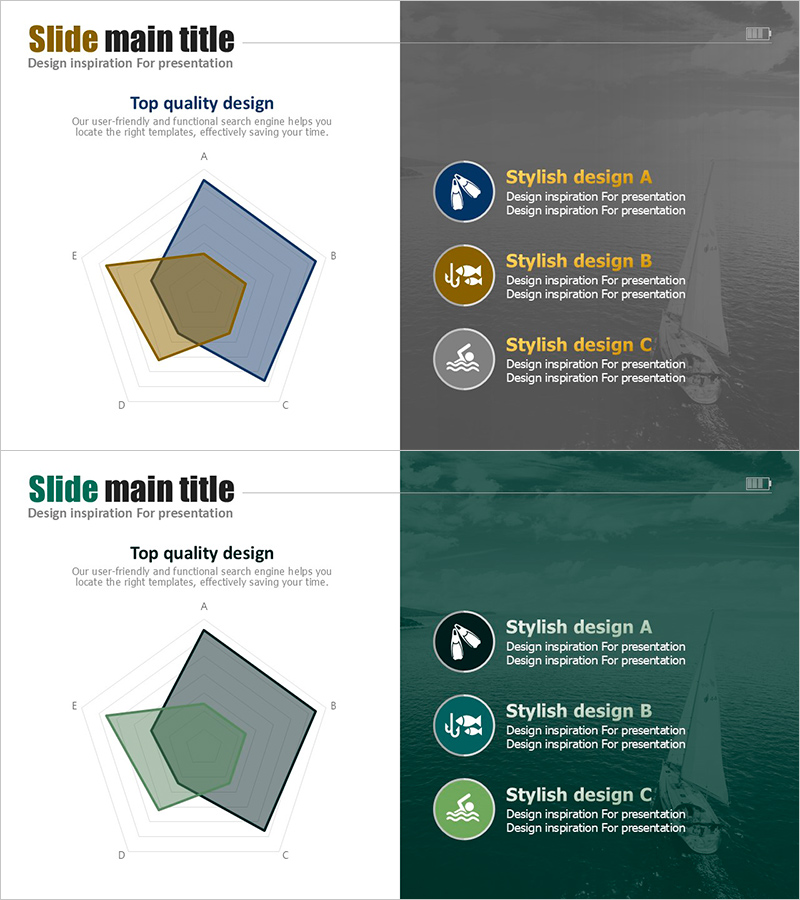
A radial radar chart PowerPoint slide comparing five data dimensions across two series. Perfect for visualizing marine exploration, water sports, environmental surveys, and performance metrics. The design uses transparent blue and tan polygons overlaid to show comparative data sets, with axes radiating from the center for intuitive multi-dimensional analysis. Ideal for product presentations, competitive analysis, and performance reviews. Fully editable PPTX format with 16:9 widescreen layout.
Usage Points
-
Main Usage
Enables multi-dimensional comparison of five data points across two series using radial visualization. Ideal for identifying strengths, weaknesses, and performance gaps. Commonly used in product performance analysis, competitive benchmarking, environmental assessments, and strategic planning presentations.
-
How to Use
Simply replace axis labels and data values with your own metrics and numbers. The transparent blue and tan polygons represent two comparable datasets (e.g., current vs. target, Product A vs. Product B). Edit axis colors and background to match your presentation theme. All elements are fully customizable in PowerPoint.
-
Recommended For
Product managers, marketing teams, business analysts, academic researchers, and consulting professionals. Particularly valuable for marine industries, water sports organizations, environmental research, technology companies, and management teams requiring multi-factor performance analysis and competitive positioning.
-
Slide Structure
Two-slide set featuring identical 5-axis radial radar chart structure with different color schemes. First slide: blue and tan transparent polygons on light background. Second slide: white, gold, and gray circular icons on dark background. Both slides maintain 16:9 widescreen format and full PPTX editability across all PowerPoint versions.
Related Products
-

Highlighting Product Features with Four Radial Graphs
#Product/Service Introduction #Graph #Features
-

Two Radial Graphs for Product Feature Comparison – Highlighting Competitive Advantage
#Product/Service Introduction #Market and Competitor Analysis #Graph
-

Sailing Travel Risk Management Radar Chart
#Product/Service Introduction #Business Introduction #Diagram
-

Radar Chart Analysis Results – Market and Competitor Insights
#Product/Service Introduction #Market and Competitor Analysis #Graph
