Graph Visualizing Trends in Hobby Demand – Market Analysis Template
RJ0600090_19
- Last Update 07/14/2025
- File Size 1.7MB
- # of Slides 2
- File Format PPTX
- Slide Ratio 16:9
- Color
Keywords
- #Content-Based Slides
- #Design-Based Slides
- #Market and Competitor Analysis
- #Graph
- #Market Status
- #Market Overview
- #Column
- #Column Chart
- #16:9
- #vertical bar chart PowerPoint
- #market analysis slide template
- #demand survey graph
- #bar chart presentation
- #hobby market data visualization
- #how to create market analysis in PowerPoint
About the Product
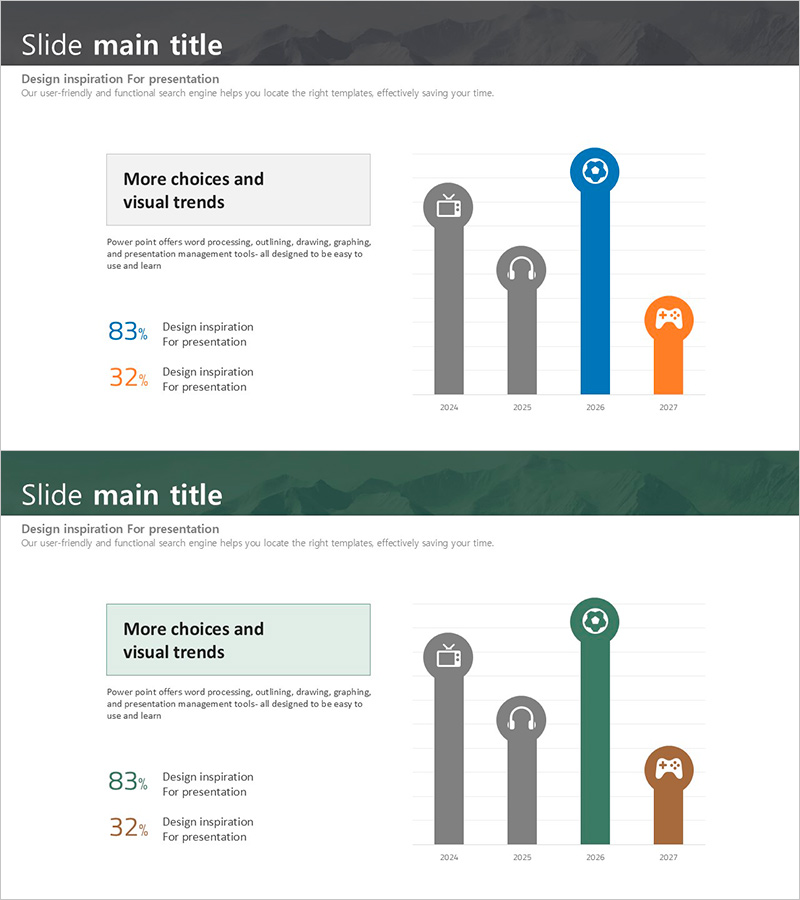
A PowerPoint slide visualizing hobby market demand trends using a vertical bar chart with 4 data series spanning 2024 to 2027. The chart uses distinct colors—blue, gray, green, and orange—to differentiate each series, enabling clear year-over-year demand comparison. A text box and statistics (83%, 32%) are positioned alongside the chart to support market overview explanations and data emphasis. In 16:9 widescreen format with 2 slides, this template is ready to edit and deploy in business reports, marketing plans, and market analysis presentations.
Usage Points
-
Main Usage
This slide clearly compares and analyzes market research data and demand trends using a vertical bar chart. Year-over-year and series-by-series demand differences are immediately apparent, and paired with statistical figures, it delivers credible market overview explanations.
-
How to Use
Deploy in the market analysis section of business reports, market overview pages of marketing plans, or market size explanation slides in investor pitch decks. Edit the chart values and colors to match your data, then insert directly into your presentation.
-
Recommended For
Marketing managers, business planners, market research analysts, and executives presenting demand survey results will find this template effective for conveying multi-series data comparisons persuasively.
-
Slide Structure
Title and subtitle area at the top; left side features a text box (More choices and visual trends) with statistics (83%, 32%); right side displays a 4-series vertical bar chart (2024–2027) with icons (briefcase, headphones, game controller) above each series to visually reinforce meaning.
Related Products
-

Market Overview PowerPoint Slide – Two Panel Market Analysis
#Market and Competitor Analysis #Graph #Market Status
-

Global Market Share and User Growth Statistics – Popularity of AI Tools
#Market and Competitor Analysis #Graph #Market Status
-

Usage Status and Trends by Application Graph - Horizontal & Vertical Bar Utilization
#Business Introduction #Market and Competitor Analysis #Graph
-

Business Promotion Strategy Presentation Template – Effective Visualization and Structured Approach
#Business Strategy #Market and Competitor Analysis #Graph
