Triangular Bar Graph of Learning Metrics – Market and Competitor Analysis
RB0300048_6
- Last Update 03/11/2025
- File Size 0.7MB
- # of Slides 2
- File Format PPTX
- Slide Ratio 4:3
- Color
Keywords
- #Content-Based Slides
- #Design-Based Slides
- #Market and Competitor Analysis
- #Graph
- #Market Status
- #Industry Trends
- #Column
- #Column Chart
- #4:3
- #triangular bar chart PowerPoint
- #pyramid chart slide template
- #trend comparison graph
- #market analysis chart
- #competitor analysis PowerPoint
- #data visualization presentation slide
About the Product
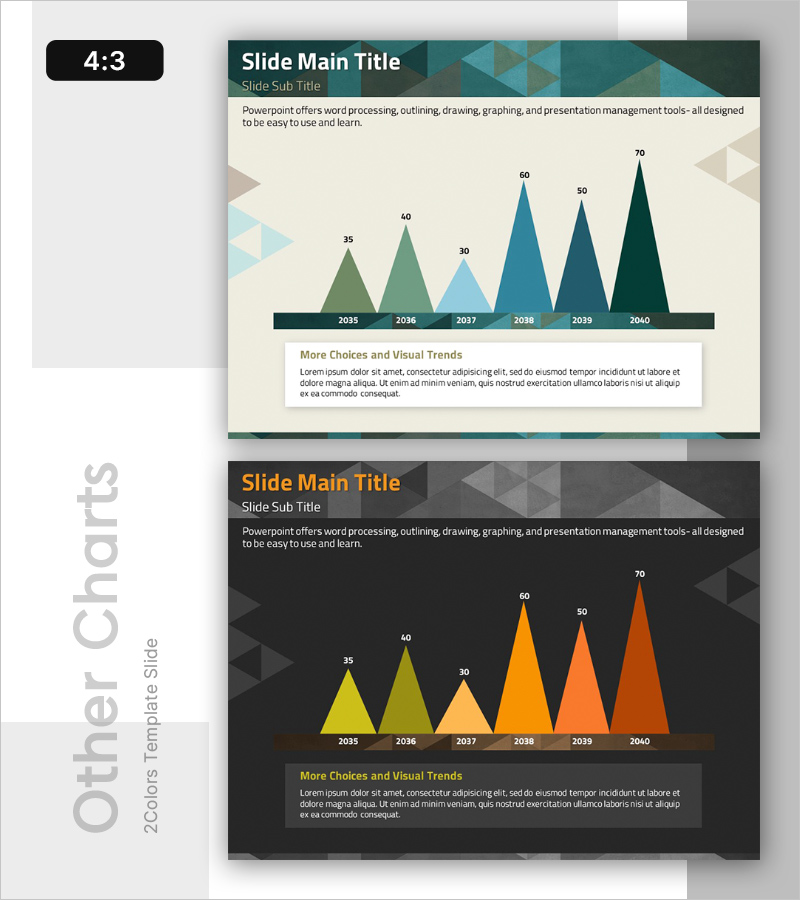
A PowerPoint slide featuring a triangular bar chart that visualizes year-over-year growth trends from 2035 to 2040. This presentation template uses pyramid-shaped bars to represent six consecutive years of data, making it ideal for market analysis, competitor benchmarking, and performance metrics. The teal-to-dark-green gradient color scheme combined with geometric background patterns adds professional credibility to your presentation. Two slide layouts are included with alternative color themes (teal, orange, and yellow) for flexible brand customization. Fully editable PPTX format allows instant data input and formatting adjustments.
Usage Points
-
Main Usage
Displays year-over-year numerical changes such as revenue growth, market share, competitor performance, or learning outcomes using pyramid-shaped bars, enabling audiences to instantly grasp upward trends and comparative relationships.
-
How to Use
Insert this slide into business reports (market analysis section), executive briefings, educational performance presentations, or competitive analysis decks when comparing multi-year quantitative data. Simply update the year labels and values; bar heights adjust automatically.
-
Recommended For
Marketing managers, business strategists, educators, consulting firms, financial analysts, and professionals who need to present data-driven insights and justify strategic decisions with visual evidence.
-
Slide Structure
Six triangular bars representing years 2035–2040 with data labels + title and subtitle header area + descriptive text box at bottom. Includes one teal-to-dark-green gradient theme and one orange-to-yellow theme, totaling 2 fully customizable slides.
Related Products
-

Market Overview PowerPoint Slide – Two Panel Market Analysis
#Market and Competitor Analysis #Graph #Market Status
-

Consumer Insights & Behavioral Patterns Analysis Slide
#Market and Competitor Analysis #Graph #Market Status
-

Market Analysis with Horizontal and Vertical Bar Charts – Recent Trends Review
#Market and Competitor Analysis #Financial Plans and Performance #Diagram
-

Horizontal Bar Chart Slide for USA Market Analysis
#Market and Competitor Analysis #Graph #Other
