Travel Tour Analysis Chart – A Comprehensive Look at the Market and Competitors
RJ0600089_15
- Last Update 07/14/2025
- File Size 9.5MB
- # of Slides 2
- File Format PPTX
- Slide Ratio 16:9
- Color
Keywords
- #Content-Based Slides
- #Design-Based Slides
- #Market and Competitor Analysis
- #Diagram
- #Market Analysis
- #Cluster
- #Chain Diagram
- #16:9
- #magnifying glass diagram PowerPoint
- #connection diagram slide
- #cluster visualization
- #travel market analysis chart
- #competitor analysis diagram
- #market research PowerPoint template
About the Product
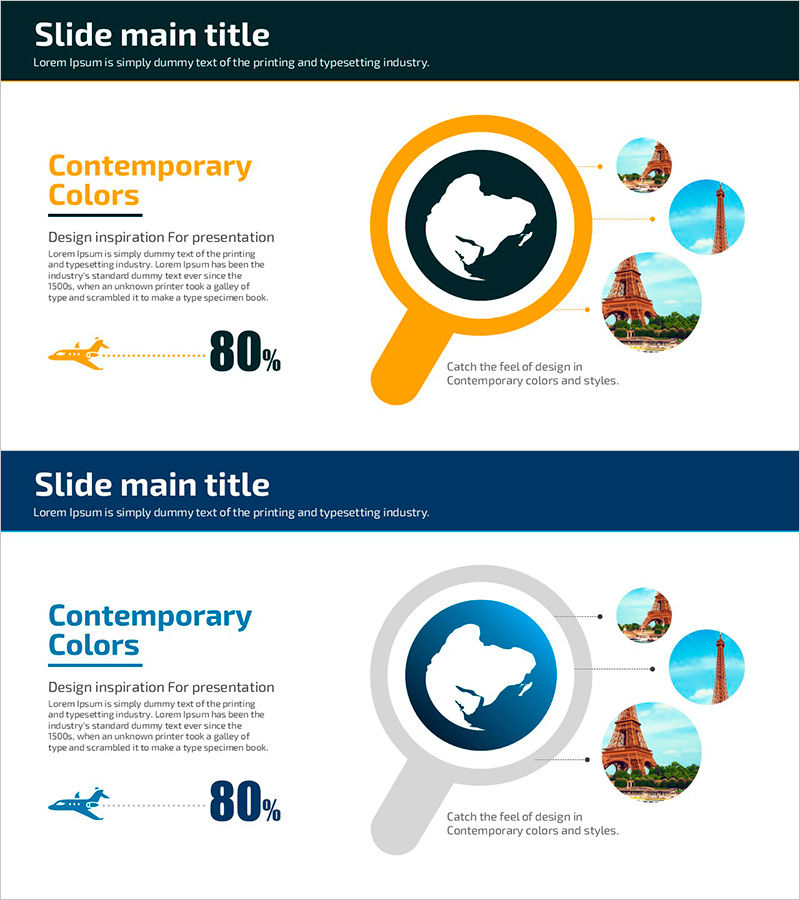
A magnifying glass-shaped connection diagram PowerPoint slide designed for travel and market analysis presentations. The central magnifying glass icon contains a map silhouette, with three circular image nodes connected via dotted lines on the right side. The design uses orange, dark navy, and gray tones to establish clear visual hierarchy, with text area and 80% numerical representation positioned on the left. Instantly applicable for data-driven presentations on market research, competitor analysis, and destination showcases. The 2-slide set provides multiple color variations (orange and gray) for flexible presentation needs.
Usage Points
-
Main Usage
Visualizes core data in travel, tourism, and market analysis presentations using a magnifying glass-shaped diagram. The center-focused structure emphasizes key information (map and market data), while three image nodes on the right connect related items (competitors, regions, trends) to clearly express relationships and dependencies.
-
How to Use
Enter your analysis topic in the title slide and describe analysis background and objectives in the left text area. Insert competitor logos, regional photos, or market data visualizations into the three circular image areas on the right, using dotted lines to show connections. Modify the 80% figure to represent market share, satisfaction rate, or growth rate as needed.
-
Recommended For
Recommended for travel agencies, tourism boards, and marketing teams presenting market analysis. Ideal for executive reports, investor presentations, and business proposal market analysis sections. Particularly optimized for three-item comparative analysis such as competitor benchmarking, regional analysis, and customer segmentation.
-
Slide Structure
2-slide set. Each slide features a left text area (title, description, metrics), center magnifying glass icon (with map silhouette), and three circular image nodes on the right (connected by dotted lines). Color variations: Slide 1 orange tone, Slide 2 gray tone. Optimized for 16:9 widescreen format.
Related Products
-

Market Competitive Advantage Analysis with Donut Graph
#Market and Competitor Analysis #Diagram #Graph
-

Pentagon Diagram & Table Chart – Market Analysis and Competitive Insight
#Market and Competitor Analysis #Diagram #Market Analysis
-

Worldwide Organic Food Production Map – Global Market Analysis
#Company Introduction #Market and Competitor Analysis #Diagram
-

3D Printer Analysis Bar Graph
#Market and Competitor Analysis #Diagram #Graph
