Survey Colorful Chart – Visuals for Information Delivery
RJ0600086_25
- Last Update 07/13/2025
- File Size 0.3MB
- # of Slides 2
- File Format PPTX
- Slide Ratio 16:9
- Color
Keywords
About the Product
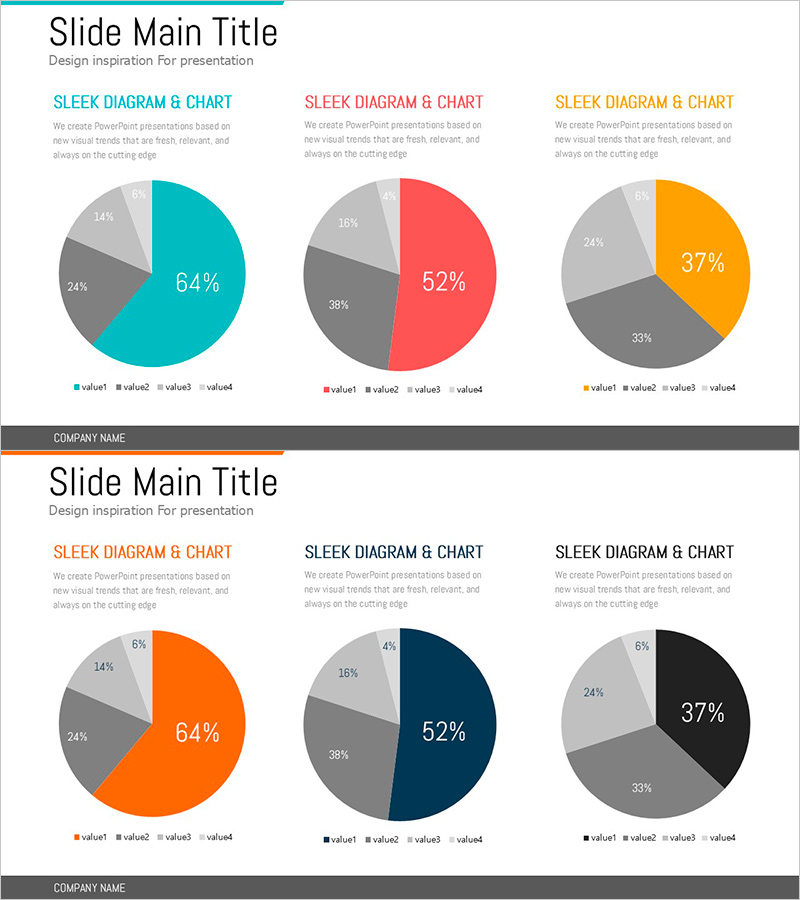
A PowerPoint slide template featuring pie charts for visualizing survey results and data proportions. Three circular graphs are arranged on a single slide, each divided into four segments using teal, red, orange, and black colors. Each chart clearly displays percentage ratios with prominent numerical labels (64%, 52%, 37%, etc.). The 16:9 widescreen format includes 2 slides with title and description text areas above each chart, ready for immediate use in presentations, reports, and analysis documents. Ideal for survey data, market research, statistical analysis, and proportion-based information delivery.
Usage Points
-
Main Usage
Visualize survey results, market research data, and statistical proportions using pie charts. Each segment is color-coded and labeled with percentages, enabling audiences to quickly understand data composition and comparative ratios across multiple datasets.
-
How to Use
Edit the title field above each pie chart to reflect your survey topic or data category. Modify the legend text and update the chart data using PowerPoint's built-in chart editing tools. Adjust colors and percentages to match your actual data, and add supporting text below each chart for context.
-
Recommended For
Marketing teams presenting customer survey findings, executive reports with statistical sections, academic presentations of survey analysis, consulting proposals showing market research, business plans with opinion poll results, and data-driven strategy documents.
-
Slide Structure
Two slides, each containing 3 pie charts arranged horizontally. Each chart displays 4 segments (teal, red, orange, black) with large percentage values (64%, 52%, 37%), legend labels, title area, and descriptive text field below.
Related Products
-

Visual Summary of Metrics and Key Data Points – Slide for Data Analysis
#Graph
-

Analyzing ABC District Occupancy with Doughnut Chart
#Market and Competitor Analysis #Graph #Other
-

Planterior Market Overview – Insights through Horizontal Bar Graph
#Market and Competitor Analysis #Graph #Market Overview
-

Business Idea Development Analysis Circle Graph
#Business Introduction #Market and Competitor Analysis #Diagram
