Direction and Keyword Diagram – Optimized for Information Delivery
RJ0600086_21
- Last Update 07/13/2025
- File Size 0.2MB
- # of Slides 2
- File Format PPTX
- Slide Ratio 16:9
- Color
Keywords
About the Product
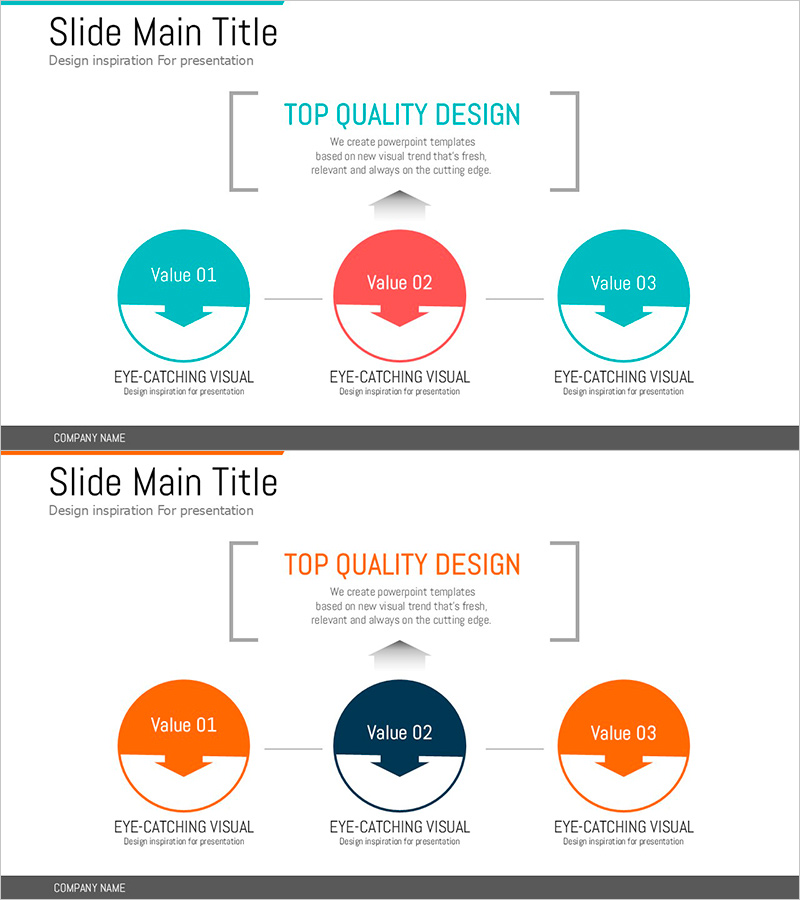
A PowerPoint slide featuring three items visualized as circular diagram nodes in teal and orange dual-tone color scheme. Each circular node displays Value 01, 02, and 03 with descriptive text below, ideal for comparative analysis and information delivery. This presentation template works well for business strategy, marketing analysis, product comparison, and competitive positioning. The 2-slide set in 16:9 widescreen PPTX format is ready to edit and customize for your presentation needs.
Usage Points
-
Main Usage
This slide presents three items with equal emphasis through circular node arrangement, highlighting independence while showing relationships via horizontal connector lines. Ideal for marketing strategy, product positioning, organizational structure comparison, and value proposition presentations.
-
How to Use
Replace 'Value' text in each circular node with your item names and add detailed descriptions in the text areas below. The three-color scheme (teal, red/orange, gray) allows you to establish emphasis hierarchy. Adjust node size and text length to fit your presentation context and speaking time.
-
Recommended For
Marketing professionals, business strategists, and sales teams benefit from this layout when explaining product features, competitive comparisons, or business initiatives. Suitable for executive briefings, investor pitch decks, client proposals, and training seminars.
-
Slide Structure
Two-slide set with different color variations: first slide uses teal-red-teal scheme, second uses orange-navy-orange scheme. Each slide features a title area at top, three circular nodes with horizontal connectors in the center, and company name bar at bottom.
Related Products
-

Information on Eco-Friendly Business Items – Business Innovation
#Product/Service Introduction #Diagram #Product/Service Introduction
-

Fruit Introduction Diagram Slide – Fresh Business Potential
#Product/Service Introduction #Diagram #Product/Service Introduction
-

Stacked Vertical Bar Chart Layout – Product Performance Analysis
#Product/Service Introduction #Marketing Plan and Strategy #Diagram
-

Business Goal Diagram – A Fresh Vision for Financial Planning
#Product/Service Introduction #Business Vision and Strategy #Diagram
