Sea Lighthouse History Donut Chart – Visualizing Maritime Business Achievements
RJ0600079_4
- Last Update 07/11/2025
- File Size 2.7MB
- # of Slides 2
- File Format PPTX
- Slide Ratio 16:9
- Color
Keywords
About the Product
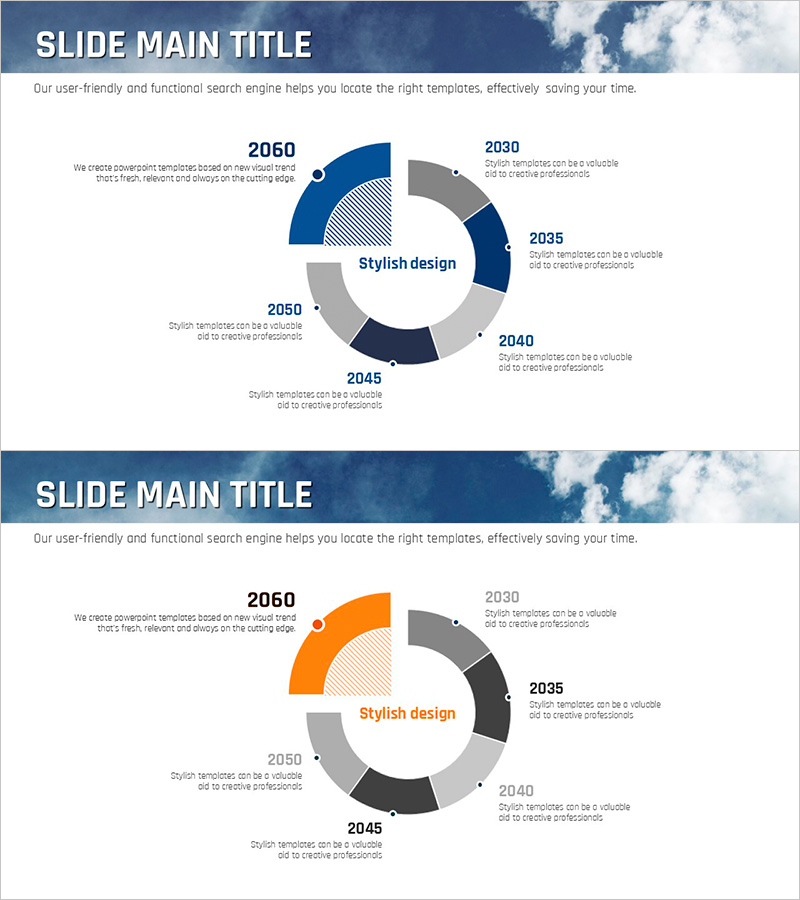
A 6-segment donut chart PowerPoint slide featuring navy blue, orange, and gray color tones for visualizing proportional data across time periods or categories. The center area accommodates key messaging, making it ideal for presenting company history, business achievements, revenue composition, market share, and performance metrics. This slide deck uses a 16:9 widescreen format with 2 slides, ready for immediate editing and customization to match your presentation narrative.
Usage Points
-
Main Usage
Donut charts emphasize proportional relationships while reserving the center area for key messaging. This slide effectively displays company history by era, revenue distribution by business unit, customer demographics, market share breakdown, and other 6-item ratio comparisons with visual clarity and professional impact.
-
How to Use
Edit each segment's color and numerical values to input your actual data. Replace the center text with company name, year, or key metric. Update surrounding labels with item names and percentages. Use this as a core data visualization slide in maritime, business performance, or strategic planning presentations to enhance credibility.
-
Recommended For
Recommended for executive reports, business performance presentations, investor relations materials, annual results briefings, and marketing analysis documents. Ideal for professionals including executives, planners, marketing managers, and finance officers, particularly in maritime, logistics, and shipping industry presentations.
-
Slide Structure
2-slide format featuring a navy-blue-accented 6-segment donut chart on slide 1 and an orange-accented 6-segment donut chart on slide 2. Each slide includes a center circular text input area and 6 outer segment label zones. Delivered in 16:9 widescreen format for seamless integration into modern presentations.
Related Products
-

History of Eco-Friendly Energy Business – Visualization of Key Achievements
#Company Introduction #Diagram #History
-

Doughnut Chart Template for Digital Marketing Strategy
#Company Introduction #Marketing Plan and Strategy #Graph
-

Premium Management Presentation – Pie Business Model
#Company Introduction #Financial Plans and Performance #Graph
-

Identity Presentation Wide Company Overview – Rich Information Delivery
#Company Introduction #Graph #Company Overview
