Doughnut Chart Template for Digital Marketing Strategy
RJ0200033_29
- Last Update 04/07/2025
- File Size 1MB
- # of Slides 2
- File Format PPTX
- Slide Ratio 16:9
- Color
Keywords
- #Content-Based Slides
- #Design-Based Slides
- #Company Introduction
- #Marketing Plan and Strategy
- #Graph
- #Other
- #Key Achievements
- #Circles
- #Doughnut Chart
- #Mockup
- #16:9
- #doughnut chart PowerPoint
- #pie chart presentation slide
- #marketing performance analysis chart
- #ratio visualization PPT
- #donut graph template
About the Product
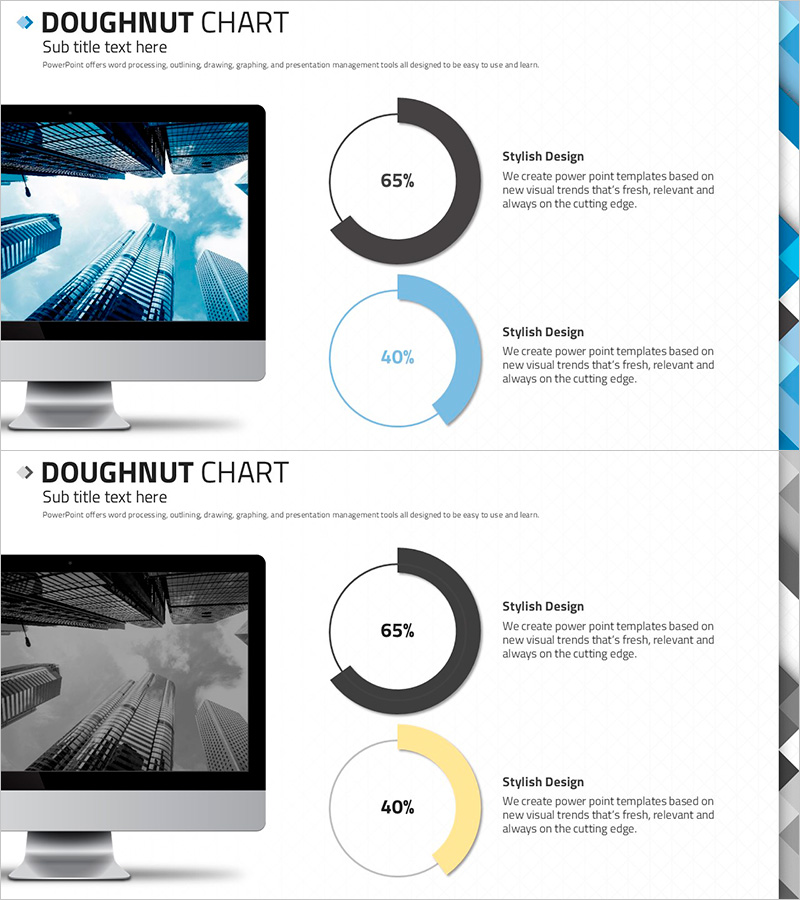
Essential doughnut chart PowerPoint slides for marketing performance analysis and digital strategy presentations. This 2-slide set features a dark gray and light blue two-tone doughnut chart on the first slide, and a gray and yellow two-tone doughnut chart on the second slide. Each slide emphasizes key metrics such as 65% and 40%, with an image area positioned on the left for visual balance. Designed in 16:9 widescreen format optimized for modern presentation environments, delivered as fully editable PPTX files. Perfect for marketing reports, quarterly performance presentations, client proposals, and business strategy discussions.
Usage Points
-
Main Usage
Optimized for comparing two key metrics such as marketing campaign performance, customer satisfaction rates, market share, and budget allocation using doughnut chart visualization. The center space of the doughnut chart allows insertion of additional text or icons, while the right text area on each slide accommodates detailed explanations and insights.
-
How to Use
Slide 1 uses a dark gray 65% + light blue 40% doughnut chart to emphasize primary performance metrics, while Slide 2 employs a gray 65% + yellow 40% doughnut chart to represent contrasting data. Insert relevant photos or supporting graphics in the left image area, then add interpretation and insights in the right text section to complete the presentation.
-
Recommended For
Marketing managers, sales directors, business executives, management consultants, and data analysts preparing quarterly or annual performance reports, client proposals, internal meeting materials, and strategic business presentations.
-
Slide Structure
2-slide layout with each slide divided into three sections: left image area (approximately 40% of 16:9 widescreen), center doughnut chart (65% + 40% two-tone segments), and right text description area (accommodates 3-4 lines of text). The doughnut chart displays percentages in the center with color-coded segments for each data series.
Related Products
-

Online Business Marketing Strategy – Data-Driven Decision Making
#Product/Service Introduction #Marketing Plan and Strategy #Graph
-

Little Witch and Donut Chart – Visualizing Achievements in Presentation Slide
#Company Introduction #Product/Service Introduction #Graph
-

Target Market Progress Graph – Effective Marketing Strategy
#Market and Competitor Analysis #Marketing Plan and Strategy #Graph
-

Technology Achievement Donut Chart
#Product/Service Introduction #Business Introduction #Graph
