Animal Nature Conservation Program Facility Investment Plan Chart
RJ0600074_19
- Last Update 07/09/2025
- File Size 3MB
- # of Slides 2
- File Format PPTX
- Slide Ratio 16:9
- Color
Keywords
- #Content-Based Slides
- #Design-Based Slides
- #Market and Competitor Analysis
- #Financial Plans and Performance
- #Graph
- #Market Analysis
- #Sales and Revenue
- #Column
- #Grouped Column
- #16:9
- #clustered horizontal bar chart PowerPoint
- #dual-series comparison slide
- #facility investment plan presentation
- #positive-negative data visualization
- #bar graph template download
About the Product
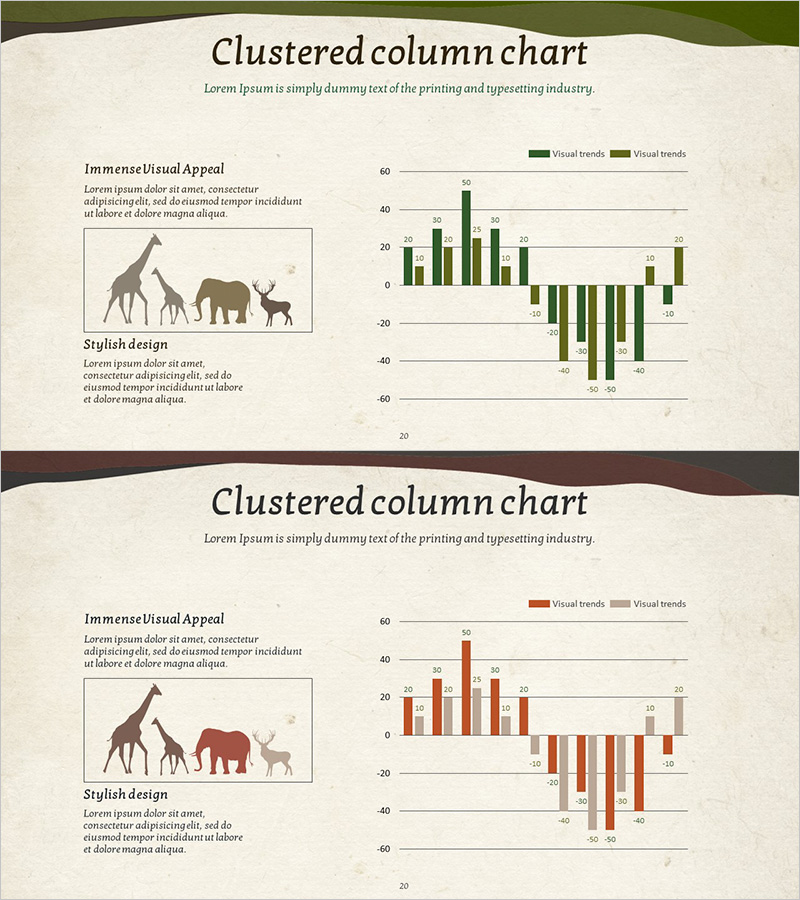
A clustered horizontal bar chart PowerPoint slide designed to visualize facility investment plans for animal nature conservation programs. The slide features two data series in green and brown colors, enabling simultaneous comparison of visual trends and actual metrics with both positive and negative values. The left side includes animal silhouette illustrations and descriptive text areas that reinforce the program context. Composed of 2 slides in 16:9 widescreen format, this presentation template is ready to use for financial planning, market analysis, investment performance reports, and various business presentations.
Usage Points
-
Main Usage
Compares financial data and market indicators across two series simultaneously. Effectively displays mixed positive and negative values such as investment performance, profitability analysis, and market trend changes. The left-side illustration and text area strengthen the thematic context of the program.
-
How to Use
Adjust bar lengths and colors to match your data, then input program descriptions and key points in the left text box. Clarify the meaning of both data series using the legend, and modify axis labels and values to fit your presentation context. Animal silhouettes can be replaced with alternative images matching your theme.
-
Recommended For
Ideal for finance teams, investment managers, and business development professionals presenting quarterly or annual investment performance. Particularly suited for environmental conservation projects, facility expansion plans, and budget-versus-actual analysis presentations. Also effective for board reports, shareholder briefings, and government funding applications.
-
Slide Structure
Both slides share identical layouts. The left side features a title at the top, animal silhouette illustrations, and descriptive text areas in the center. The right side displays a horizontal bar chart centered at zero, with positive values extending upward and negative values extending downward. Two data series are color-coded in green and brown, with legend and axis labels included.
Related Products
-

Revenue Vertical Bar Chart – Innovation in Market Analysis
#Market and Competitor Analysis #Financial Plans and Performance #Graph
-

Horizontal Bar Chart Visualizing Market Sales Status
#Market and Competitor Analysis #Financial Plans and Performance #Graph
-

Sales and Profit Table – Visualizing Financial Performance
#Market and Competitor Analysis #Financial Plans and Performance #Diagram
-

Performers and Bundled Charts – Sales and Revenue Analysis
#Market and Competitor Analysis #Financial Plans and Performance #Graph
