Survey of Animal Distribution by European Region – Insights on Market Analysis
RJ0600074_17
- Last Update 07/09/2025
- File Size 3.5MB
- # of Slides 2
- File Format PPTX
- Slide Ratio 16:9
- Color
Keywords
About the Product
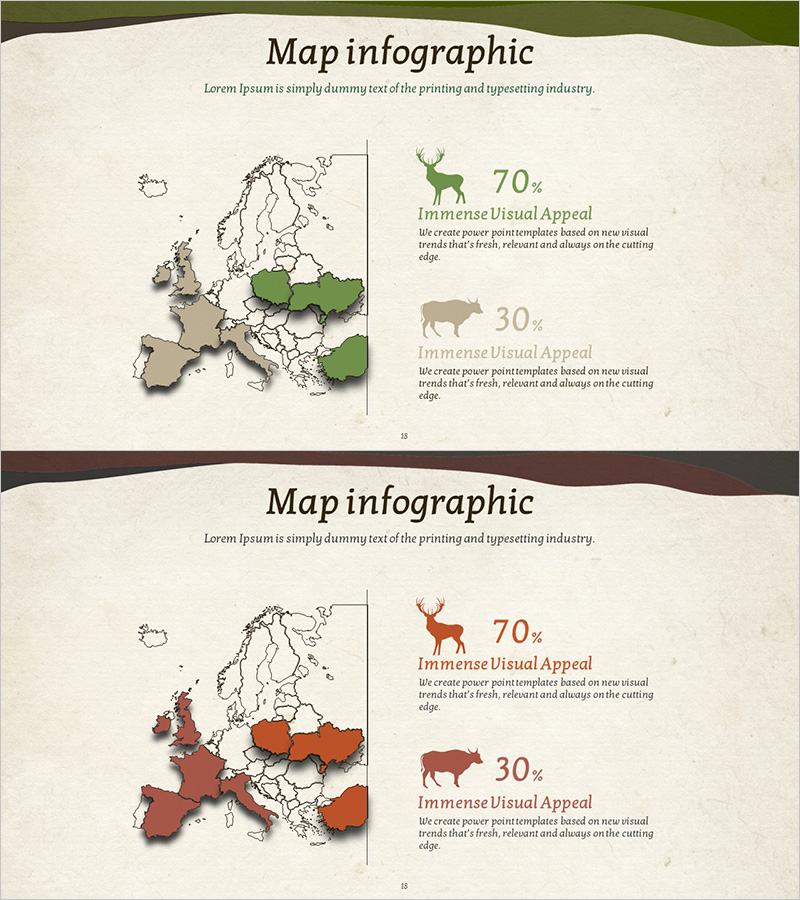
A PowerPoint slide visualizing animal distribution across European regions using maps and icons. The presentation includes two slides: the first with beige and green tones, and the second with beige and wine-red tones. Each slide features a European map with animal icons and percentage data arranged in a balanced layout. This design is ideal for market analysis, regional insights, and competitive landscape presentations. The 16:9 widescreen PPTX format is fully editable across all presentation software platforms.
Usage Points
-
Main Usage
Transform regional data into map-based infographics to enhance information delivery in market analysis, regional landscape, and competitive positioning presentations. The animal distribution example helps audiences intuitively grasp regional characteristics and differences.
-
How to Use
Replace the map regions, animal icons, and percentage data with your own regional information. Maintain the color scheme (green or wine-red) or customize with your corporate brand colors to create a cohesive presentation.
-
Recommended For
Marketing managers, business development teams, market analysts, and consultants who support decision-making with regional data. Particularly valuable for market entry strategies, customer segmentation by region, and competitive environment analysis.
-
Slide Structure
Two-slide layout with each slide divided into left (European map with country-level color coding) and right (two animal icons with percentage data) sections. Four text input areas (title, description, icon labels, data) optimize the layout for comparative analysis.
Related Products
-

3 Market Share Analysis – Differentiated Market Strategy
#Market and Competitor Analysis #Graph #Other
-

Donut Chart & Map Template for Social Network Visualization
#Market and Competitor Analysis #Graph #Other
-

Wide Box Template Visualizing Market Share with Pie Chart
#Market and Competitor Analysis #Graph #Market Status
-

Simple Circle Template – Horizontal Segmentation Graph
#Market and Competitor Analysis #Graph #Market Status
