Pie Chart Slide Visualizing Transportation Status
RB0100045_8
- Last Update 03/06/2025
- File Size 0.5MB
- # of Slides 2
- File Format PPTX
- Slide Ratio 4:3
- Color
Keywords
About the Product
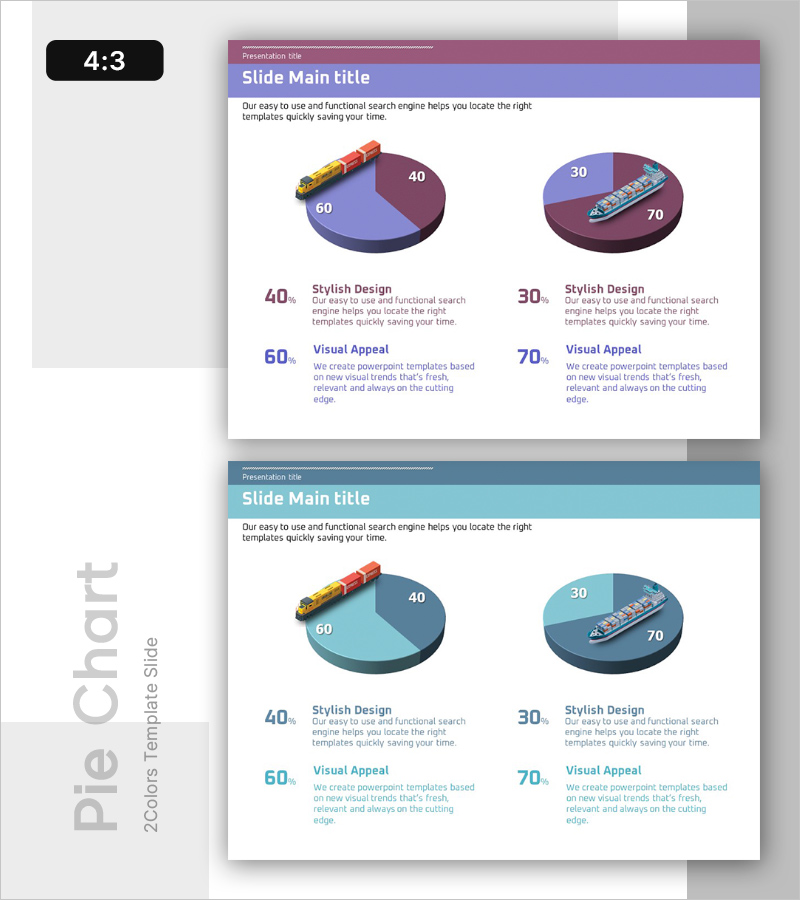
A 3D pie chart slide set visualizing transportation industry market status and market share. The slide features two three-dimensional pie charts in purple and blue tones, each divided into 2-3 segments representing different data categories. A cargo ship icon is positioned above the charts to reinforce the transportation context. The left chart displays a 60%-40% ratio while the right chart shows a 70%-30% ratio, with descriptive text labels beneath each segment. This PowerPoint slide template is ready to use in market analysis, business status reports, and executive presentations with fully editable data fields and color schemes.
Usage Points
-
Main Usage
Visualize and compare transportation industry market share, business performance, and operational metrics using proportional pie chart representation. The 3D design enhances visual impact and audience engagement, while dual charts enable simultaneous comparison of multiple data sets in market analysis and executive reports.
-
How to Use
Apply this slide in executive briefings, investor presentations, market analysis reports, and business status meetings to illustrate transportation-related numerical data. Simply replace the chart segments and labels with your own data values, and customize colors and layout as needed. The slide is fully compatible with PowerPoint editing tools.
-
Recommended For
Executives, marketing professionals, business analysts, consultants, and transportation/logistics industry specialists presenting market conditions and competitive positioning. Particularly effective when comparative analysis is required, as the dual-chart layout emphasizes contrasts and relationships between datasets.
-
Slide Structure
Two slides in 4:3 aspect ratio. Each slide contains a title area at the top, two 3D pie charts positioned side-by-side in the center, and descriptive text labels in the lower section. Pie segments are divided into 2-3 portions with numerical labels and legend indicators. A transportation icon is overlaid on the charts to reinforce industry context and data relevance.
Related Products
-

Market Share Analysis of Wind and Solar Energy
#Market and Competitor Analysis #Graph #Market Status
-

Market Targets and Status Chart – Visually Appealing Insights
#Market and Competitor Analysis #Graph #Market Status
-

Pie Chart for Workout Type Preferences – Market Status
#Market and Competitor Analysis #Diagram #Graph
-

3D Pie Chart Analysis (Green & Blue) – Market Share Visualization
#Market and Competitor Analysis #Graph #Market Status
