Presentation Slide Visually Capturing Farming Harvest Business Production and Technology Development Strategy
RJ0600073_13
- Last Update 07/09/2025
- File Size 4.1MB
- # of Slides 2
- File Format PPTX
- Slide Ratio 16:9
- Color
Keywords
- #Content-Based Slides
- #Design-Based Slides
- #Business Strategy
- #Technical Approach
- #Diagram
- #Future Development Roadmap
- #Flow
- #Linear Flow
- #Project Progress
- #16:9
- #arc arrow diagram PowerPoint
- #timeline visualization slide
- #two-stage process diagram
- #business progress PPT
- #technology development strategy slide
- #project timeline PowerPoint template
About the Product
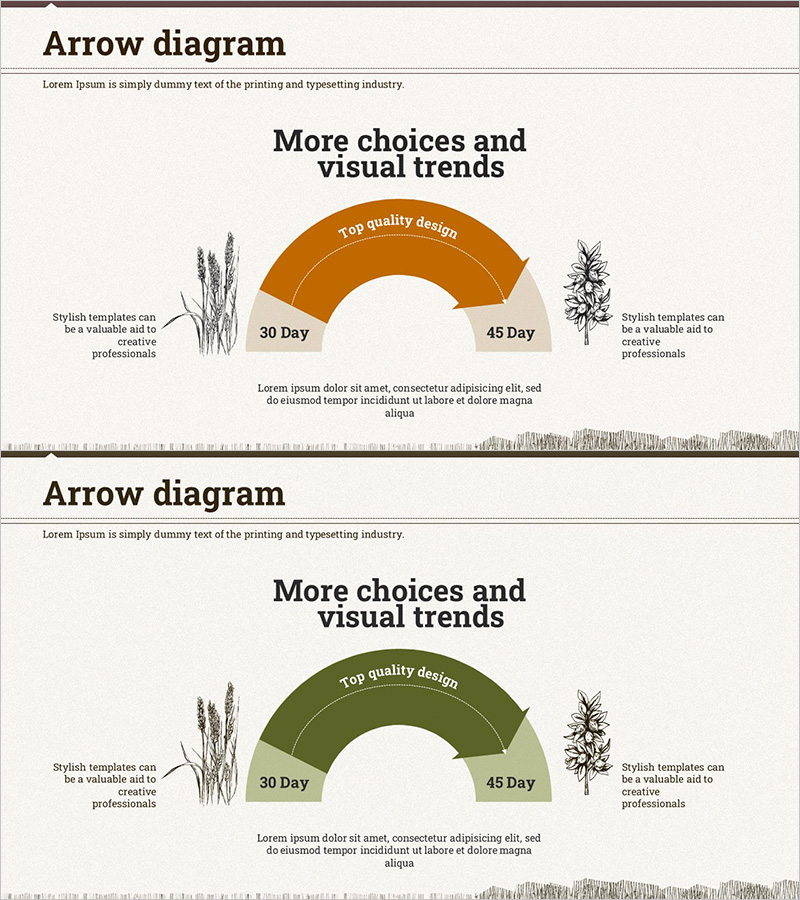
A two-stage arc arrow diagram PowerPoint slide designed to visualize business progress and technology development strategy along a timeline. Available in two color versions—burnt orange and olive green—each clearly distinguishing 30-day and 45-day phases. The central arc arrow intuitively represents time progression, with text areas on both sides for detailed explanations, enabling efficient information delivery. Ideal for agricultural, production, and technology development presentations where you need to emphasize phased progress, project timelines, and comparative results. Provided in 16:9 widescreen format, PPTX file type, fully editable.
Usage Points
-
Main Usage
Clearly express phased information along a timeline—such as project schedules, technology development stages, and comparative results—using an arc arrow diagram. Effectively highlights business progress reports, technology development strategies, and milestone achievements in agriculture, production, and manufacturing sectors.
-
How to Use
Enter initial phase descriptions (e.g., planning, preparation) in the left text area and later phase descriptions (e.g., completion, evaluation) in the right area. Modify the arc arrow color and phase labels (30 days, 45 days, etc.) to match your project timeline. Select either the burnt orange or olive green version to align with your presentation's color scheme.
-
Recommended For
Recommended for business progress reports in agriculture, food, and production companies; technology development project presentations; manufacturing process explanations; and timeline sections in marketing plans. Suitable for executive briefings, investor presentations, internal meetings, and seminar talks.
-
Slide Structure
Two-slide set. Each slide features a central arc arrow diagram with two-stage nodes, left and right text boxes, and a bottom description area. Burnt orange and olive green versions provided separately, allowing you to maintain color consistency throughout your presentation.
Related Products
-

Internet Security Platform Structure Diagram – Stability and Innovation
#Business Strategy #Technical Approach #Diagram
-

Purple Circle Flow Diagram – Visually Enhance Business Strategy
#Business Strategy #Marketing Plan and Strategy #Diagram
-

Business Progress Slide – Business Strategy
#Business Strategy #Diagram #Flow
-

Step Flowchart for Business Execution Strategy
#Business Strategy #Diagram #Step-by-Step Schedule Plan
