Sailing Travel Business Goal Market Strategy Horizontal Chart
RJ0600072_32
- Last Update 07/09/2025
- File Size 0.2MB
- # of Slides 2
- File Format PPTX
- Slide Ratio 16:9
- Color
Keywords
About the Product
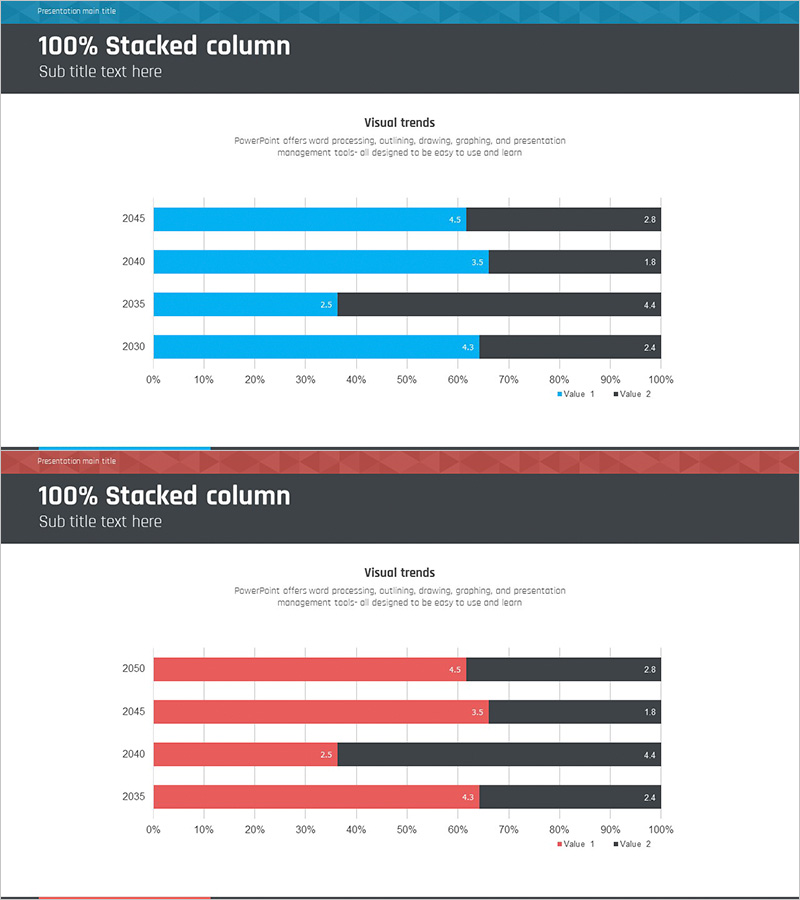
A horizontal bar chart PowerPoint slide designed to visualize business goals and market strategy across multiple years. This presentation template displays data from 2030 to 2045 in two distinct series (blue and black bars), with numerical labels clearly marked on each bar. Ideal for travel, sailing, and tourism industry presentations, it effectively communicates performance metrics, market share, and goal achievement. The 16:9 widescreen format includes 2 slides that are fully editable—simply replace the sample data with your own figures and customize the labels to match your presentation context.
Usage Points
-
Main Usage
Clearly visualizes year-over-year and item-by-item numerical comparisons while highlighting business performance trends. The dual-color bar system (blue and black) enables side-by-side data representation, delivering an intuitive visual impact to executives, investors, and team members.
-
How to Use
Integrate this slide into business plans, quarterly reports, investor pitch decks, and marketing strategy presentations during the performance analysis section. Replace the 2030–2045 timeline with your reporting period and update the blue and black values with your actual data points.
-
Recommended For
Executives, business managers, marketing teams, financial analysts, and consultants presenting quarterly reviews, strategic initiatives, and performance evaluations. Applicable across all industries—travel, tourism, logistics, transportation, hospitality, and beyond—wherever comparative data analysis is required.
-
Slide Structure
2-slide deck. Slide 1 emphasizes the blue data series; Slide 2 emphasizes the red data series—both displaying the same 4-year dataset from different analytical perspectives. Each bar extends from 0–100% on a horizontal axis, with numerical labels (ranging 1.8–4.5) positioned at the bar endpoints for precise data reference.
Related Products
-

Competitor Analysis Broken Line Graph
#Market and Competitor Analysis #Graph #Competitor Analysis
-

User Analysis Graph by Age Group – Advanced Data Insights
#Market and Competitor Analysis #Diagram #Graph
-

Competitor Analysis and Competitive Advantage Visualization – Harmony of Green and Orange
#Market and Competitor Analysis #Diagram #Graph
-

Vegetable Market Status Analysis with Line Charts
#Market and Competitor Analysis #Graph #Market Status
