Pie Chart of Facility Investment Plan Inside Sailing Ship – Investment and Growth
RJ0600072_29
- Last Update 07/09/2025
- File Size 1MB
- # of Slides 2
- File Format PPTX
- Slide Ratio 16:9
- Color
Keywords
- #Content-Based Slides
- #Design-Based Slides
- #Product/Service Introduction
- #Operational Plan
- #Graph
- #Development Status
- #Capital Investment Plan
- #Circles
- #Pie Chart
- #16:9
- #pie chart PowerPoint slide
- #circular graph presentation
- #investment plan pie chart
- #ratio analysis PPT
- #facility investment presentation
- #pie chart template download
About the Product
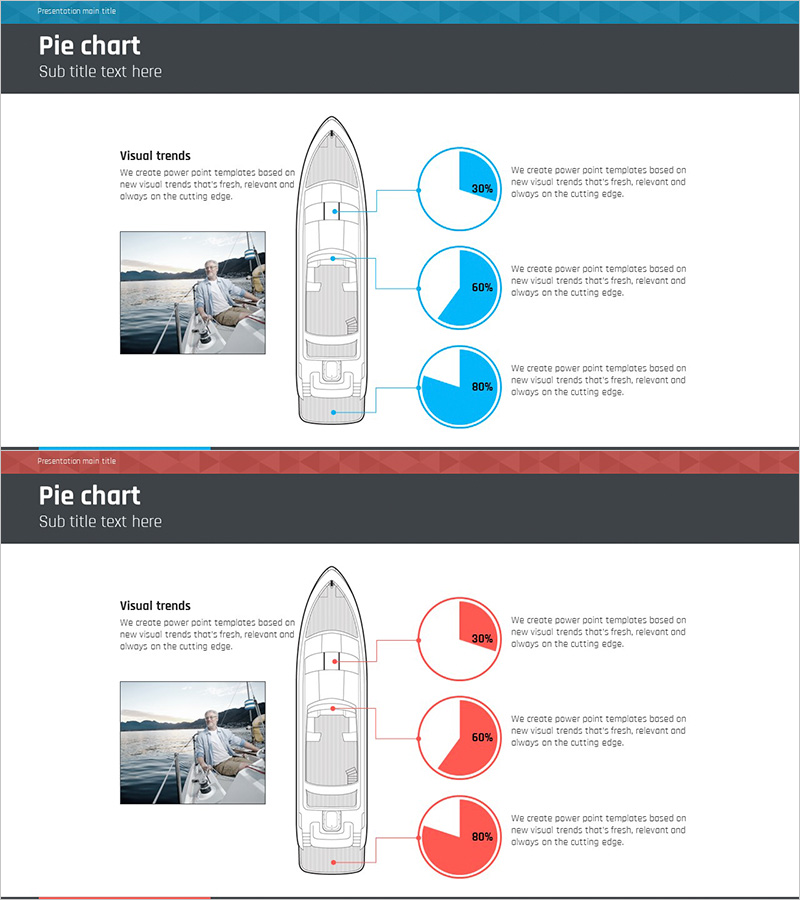
A PowerPoint pie chart slide optimized for facility investment plan presentations. This slide deck visualizes the investment ratio of three key items using a circular graph format, with a background image on the left connected to pie charts on the right via arrow connectors. The presentation template is available in two color versions—blue and red—allowing you to select based on your presentation context. Each pie segment displays percentage values to enhance data readability, with text description areas to clarify the meaning of each item. The 16:9 widescreen format includes 2 slides ready for immediate editing and customization.
Usage Points
-
Main Usage
Visualize the composition ratio of three investment items—such as facility investment plans, fund allocation, and budget distribution—using pie charts to clearly present decision-making rationale. Enables stakeholders to grasp investment priorities and resource allocation strategies at a glance.
-
How to Use
Insert relevant photos or icons in the left background image area, then update the pie chart percentages and text descriptions with your actual data. Select the color version that matches your corporate brand or presentation tone, then insert into your presentation.
-
Recommended For
CFO and finance manager investment plan presentations, executive reports, capital allocation sections in business plans, shareholder meetings, departmental budget explanation materials, and comparisons of various investment categories such as equipment, infrastructure, and marketing initiatives.
-
Slide Structure
2-slide composition. Each slide features a left image area (for photo/icon insertion), a center boat mockup diagram, and three pie charts on the right (displaying 30%, 60%, and 80% ratios). Blue and red color versions are provided separately, allowing flexible color selection for your presentation needs.
Related Products
-

Brand Awareness Distribution Chart – Market Share Analysis
#Product/Service Introduction #Market and Competitor Analysis #Graph
-

Development Status Analysis Pie Type 3D Graph
#Product/Service Introduction #Market and Competitor Analysis #Graph
-

Development Status Pie Chart – Visualizing Market Share
#Product/Service Introduction #Market and Competitor Analysis #Graph
-

3D Circle Graph for Competitor Analysis – Insight into Market Dynamics
#Product/Service Introduction #Market and Competitor Analysis #Graph
