Asian Customer Analysis Global Map for Sailing Trips
RJ0600072_22
- Last Update 07/09/2025
- File Size 0.7MB
- # of Slides 2
- File Format PPTX
- Slide Ratio 16:9
- Color
Keywords
- #Content-Based Slides
- #Design-Based Slides
- #Market and Competitor Analysis
- #Customer Success Stories
- #Graph
- #Other
- #Customer Analysis
- #Customer Testimonials and Feedback
- #16:9
- #Asian customer analysis PowerPoint slide
- #global map presentation
- #regional comparison slide
- #customer analysis map PPT
- #market analysis infographic
About the Product
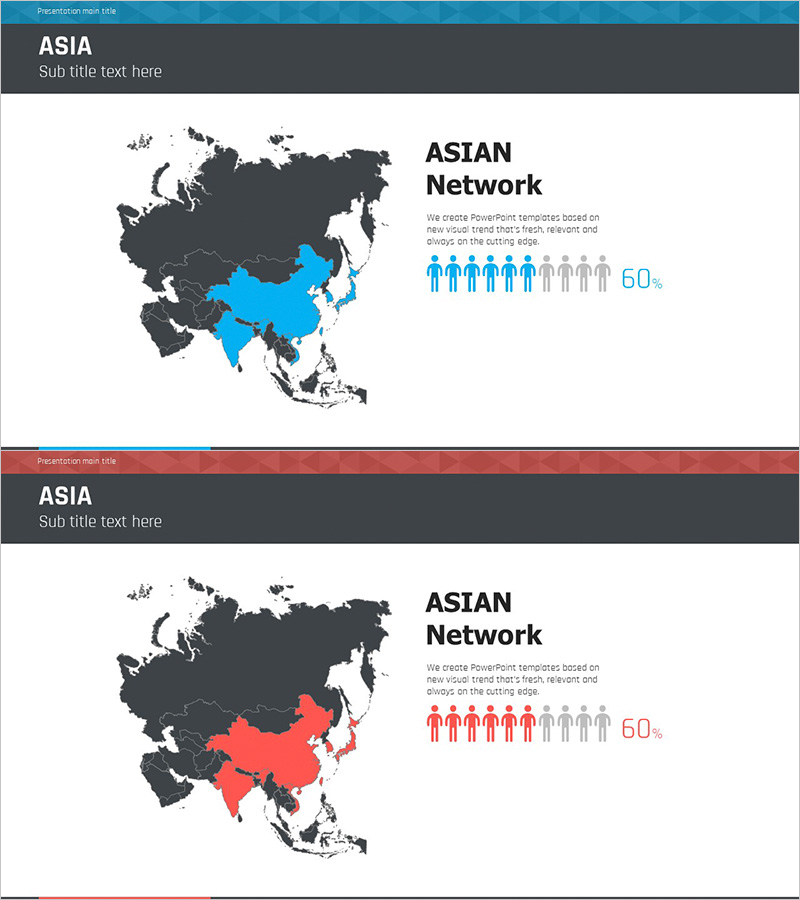
A 2-slide PowerPoint presentation for analyzing customer distribution across Asia. The slide features a dark-background Asia map with blue and red color coding to distinguish regions, accompanied by infographic-style population ratio icons on the right side. Ideal for global market analysis, customer success case presentations, and regional marketing strategy discussions. Designed in 16:9 widescreen format for optimal compatibility with modern projectors and displays.
Usage Points
-
Main Usage
This slide enables quick visual comparison of customer distribution, market share, and regional growth rates across Asia. Perfect for investor presentations, executive briefings, and marketing strategy meetings to clearly communicate regional customer status and market penetration.
-
How to Use
Replace the Asia map regions with your company's customer distribution data using blue or red colors, and update the population ratio icons and percentage figures with actual customer statistics. Use both slides sequentially to emphasize temporal changes and regional growth trends in your presentation.
-
Recommended For
Ideal for multinational companies presenting Asia market entry strategies, global enterprises sharing regional customer success cases, investment pitch decks requiring market analysis sections, and marketing teams conducting regional target customer analysis meetings.
-
Slide Structure
Two-slide layout with header section (title and subtitle), left-side Asia map on dark background with regional color differentiation, and right-side content area containing title, descriptive text, population ratio icons (10 icons), and percentage figures. Includes 4 text input areas and 2 data visualization zones for customization.
Related Products
-

Customer Evaluation and Feedback on Renewable Energy Business - Doughnut Chart
#Market and Competitor Analysis #Customer Success Stories #Graph
-

User Analysis Pictogram Graph – Visualizing Customer Success
#Market and Competitor Analysis #Customer Success Stories #Graph
-

Children Detail Analysis Chart – Customer Insights and Success Stories
#Market and Competitor Analysis #Customer Success Stories #Graph
-

Global User Count Analysis Graph – Insights on Market Trends
#Market and Competitor Analysis #Marketing Plan and Strategy #Graph
