Basic Line Charts and Tables – Essential Tools for Data Visualization
RJ0600071_7
- Last Update 07/09/2025
- File Size 1.9MB
- # of Slides 2
- File Format PPTX
- Slide Ratio 16:9
- Color
Keywords
About the Product
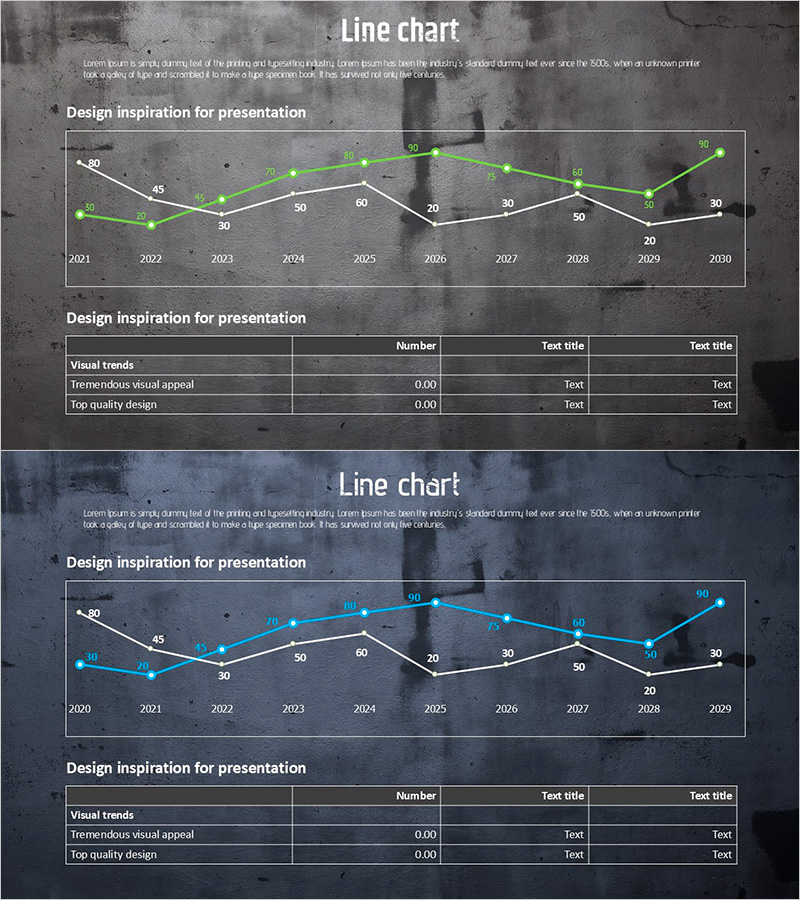
A dual-series line chart PowerPoint slide designed to visualize data trends from 2021 to 2030. The slide features green and blue line series with labeled data points at each interval, enabling precise value communication and trend comparison over time. The gray concrete background provides strong contrast for clear chart visibility. An accompanying data table slide consolidates key metrics and numerical values for comprehensive analysis. Delivered in 16:9 widescreen PPTX format, fully editable and ready for immediate use in business presentations.
Usage Points
-
Main Usage
Compares two or more data series across time periods to reveal trend patterns and performance changes. Ideal for displaying sales growth, customer metrics, KPI fluctuations, and comparative performance analysis. Labeled data points ensure accuracy and facilitate audience comprehension of specific values.
-
How to Use
Edit the line chart data values and legend on slide 1 to reflect your actual statistics. Populate the table on slide 2 with key figures and interpretive insights that support the chart narrative. During presentation, point to rising or falling segments to emphasize business implications and data-driven conclusions.
-
Recommended For
Financial reports, quarterly performance reviews, investor presentations, marketing analytics, business strategy meetings, and executive dashboards. Recommended for finance professionals, data analysts, project managers, and marketing teams who need to present quantitative evidence and support decision-making with visual data.
-
Slide Structure
Slide 1: Dual-series line chart spanning 2021–2030 with 10 data points per series and numeric labels. Slide 2: 3-column × 3-row data table with fields for visual trends, numerical values, and text annotations. Unified gray concrete texture background throughout.
Related Products
-

Aerospace Industry Progress Status Graph – Analysis and Vision Presentation
#Product/Service Introduction #Market and Competitor Analysis #Graph
-

Data Analysis Segmented Bar Graph – Technology Status and Analysis
#Product/Service Introduction #Business Introduction #Graph
-

Global Country Ranking Analysis Chart – Market and Competitor Analysis
#Company Introduction #Market and Competitor Analysis #Graph
-

Data Insights Enhanced by Highlighted Metrics
#Market and Competitor Analysis #Graph #Other
