Food Nutrient Diagram – Market Share and Status Analysis
RJ0600069_16
- Last Update 07/08/2025
- File Size 4.6MB
- # of Slides 2
- File Format PPTX
- Slide Ratio 16:9
- Color
Keywords
About the Product
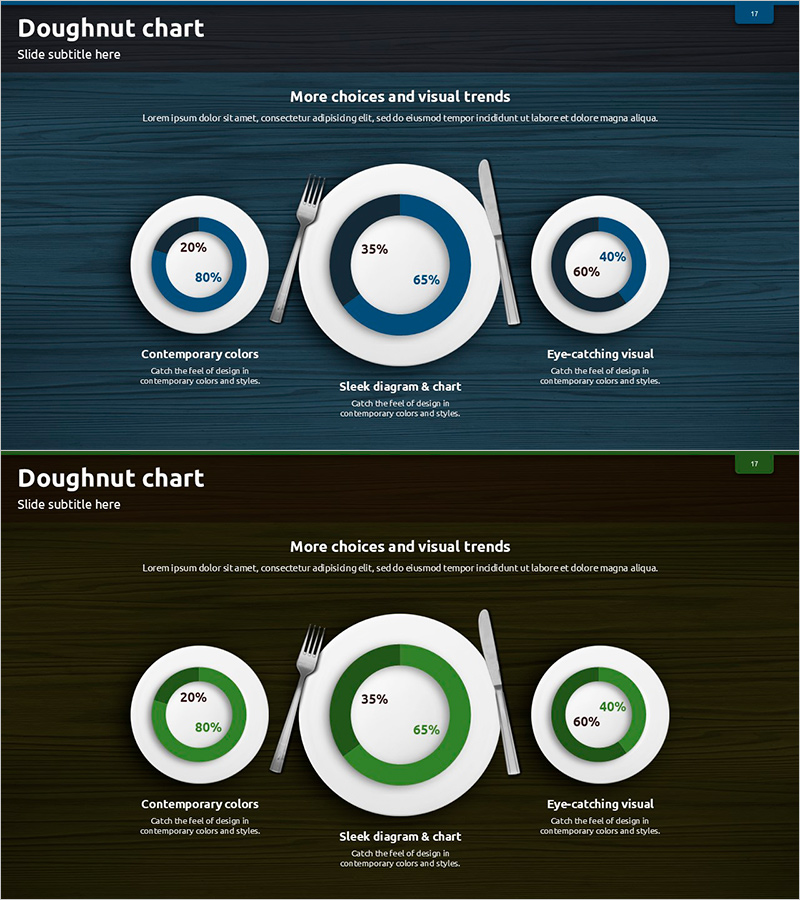
A doughnut chart PowerPoint slide designed to visualize food nutrition data and market share analysis. The slide features a dark blue background with white doughnut rings and deep blue data segments, displaying percentage values in the center circular area. Fork and knife icons emphasize the food-related theme, while three doughnut charts arranged left, center, and right enable simultaneous comparison of multiple categories. The 2-slide set is optimized for 16:9 widescreen format and ready for immediate use in presentations and business reports.
Usage Points
-
Main Usage
Intuitively displays food nutrition intake data, market share percentages, and sales distribution ratios. Three doughnut charts positioned side-by-side allow simultaneous comparison of multiple category compositions, while center-positioned percentage values ensure accurate data communication.
-
How to Use
Use in nutrition, food industry, and marketing presentations to explain product market share, consumer preferences, and nutrient composition ratios. Customize each doughnut chart's colors and values to match your data, while the dark blue background maintains a professional appearance throughout your presentation.
-
Recommended For
Recommended for food and beverage company product analysis presentations, nutrition seminars, market research reports, and sales performance analysis. Marketing teams, sales departments, and data analysts benefit from clear ratio-based information delivery.
-
Slide Structure
2-slide set with three doughnut charts positioned left, center, and right on each slide, with the center chart emphasized in larger size. Each doughnut ring divides into 2-3 data segments, with editable percentage values in the center circular area. Fork and knife icons with text labels identify each category.
Related Products
-

Enrollment Stats & Ratios Donut Chart
#Market and Competitor Analysis #Graph #Market Status
-

Logistics Market Share Chart – Current Status and Competitive Analysis
#Market and Competitor Analysis #Graph #Market Status
-

Doughnut Chart Visualizing Proportion of Grain Yields
#Market and Competitor Analysis #Graph #Market Status
-

How to Protect Your Environment Pie Chart
#Market and Competitor Analysis #Graph #Market Status
