Table Chart and Arrow Signs
RJ0500012_5
- Last Update 08/27/2025
- File Size 0.8MB
- # of Slides 2
- File Format PPTX
- Slide Ratio 16:9
- Color
Keywords
- #Content-Based Slides
- #Design-Based Slides
- #Financial Plans and Performance
- #Diagram
- #Capital Requirements
- #Budget
- #Table
- #Standard Table
- #16:9
- #arrow table PowerPoint
- #3-step diagram slide
- #financial planning template
- #budget management presentation
- #numbered signs slide
- #table chart PowerPoint template
About the Product
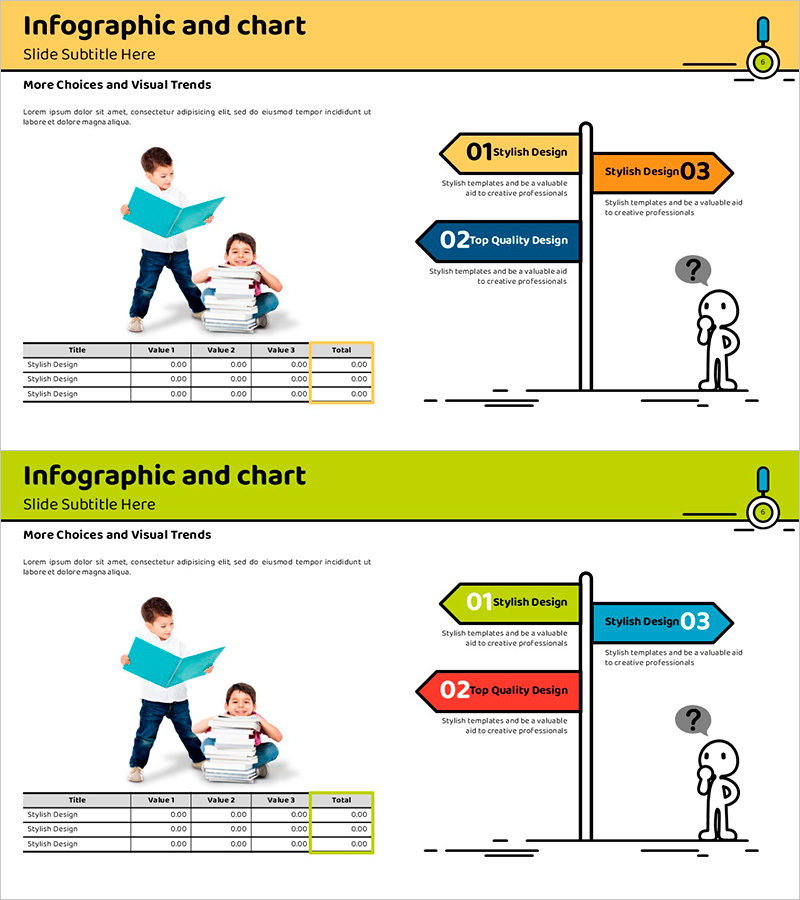
A 3-step arrow table PowerPoint slide designed for financial planning and budget management presentations. Numbered arrow signs in yellow, blue, and red clearly express sequential information and decision points. The left side features a 4-row by 4-column data table for entering actual figures, while the right side includes illustrations and visual flow emphasis. Optimized for 16:9 widescreen format in a 2-slide set, this template is ready to use for budget comparison, trend analysis, and financial status reporting. Perfect for executive presentations, investor pitches, and team meetings where complex financial data needs intuitive visual communication.
Usage Points
-
Main Usage
Visualizes financial status, budget items, and cost structure in sequential steps. Arrow signs emphasize progression, while the table organizes specific numerical data. Delivers clear financial information to executives, investors, and team members through combined visual and tabular representation.
-
How to Use
Enter budget item names, quarterly figures, targets, and actuals in the left table. Modify arrow sign text to reflect stage names (e.g., Q1/Q2/Q3 or Plan/Execute/Review). Keep the default yellow, blue, and red color scheme or customize with your company brand colors. All text fields are fully editable.
-
Recommended For
CFOs, finance managers, executives, project managers, and marketing planners presenting quarterly budget status, cost trends, and performance comparisons. Ideal for business plans, financial reports, budget review meetings, and investor presentations.
-
Slide Structure
2-slide set. Each slide features a 4-row by 4-column data table on the left (title, 3 value columns, total column) and 3 numbered arrow signs on the right (yellow, blue, red sequence) with supporting illustrations (reading child, question mark character). Optimized for 16:9 widescreen display.
Related Products
-

Blue Line Wide Template Table2 – Stylish Design for Financial Planning
#Financial Plans and Performance #Diagram #Capital Requirements
-

Budget & Schedule Management Strategy Slide – Data-Driven Planning
#Financial Plans and Performance #Diagram #Graph
-

Travel Budget and Expense Planning Slide
#Financial Plans and Performance #Diagram #Capital Requirements
-

Create a Travel Budget – Strategic Planning
#Financial Plans and Performance #Diagram #Capital Requirements
