Modern Interior Photography and Table – Financial Planning and Performance
RJ0900006_20
- Last Update 08/17/2025
- File Size 1.7MB
- # of Slides 2
- File Format PPTX
- Slide Ratio 16:9
- Color
Keywords
- #Content-Based Slides
- #Design-Based Slides
- #Financial Plans and Performance
- #Diagram
- #Capital Requirements
- #Budget
- #Table
- #16:9
- #financial data table PowerPoint slide
- #financial metrics presentation template
- #budget performance table slide
- #how to create financial reports in PowerPoint
- #business data table slide design
About the Product
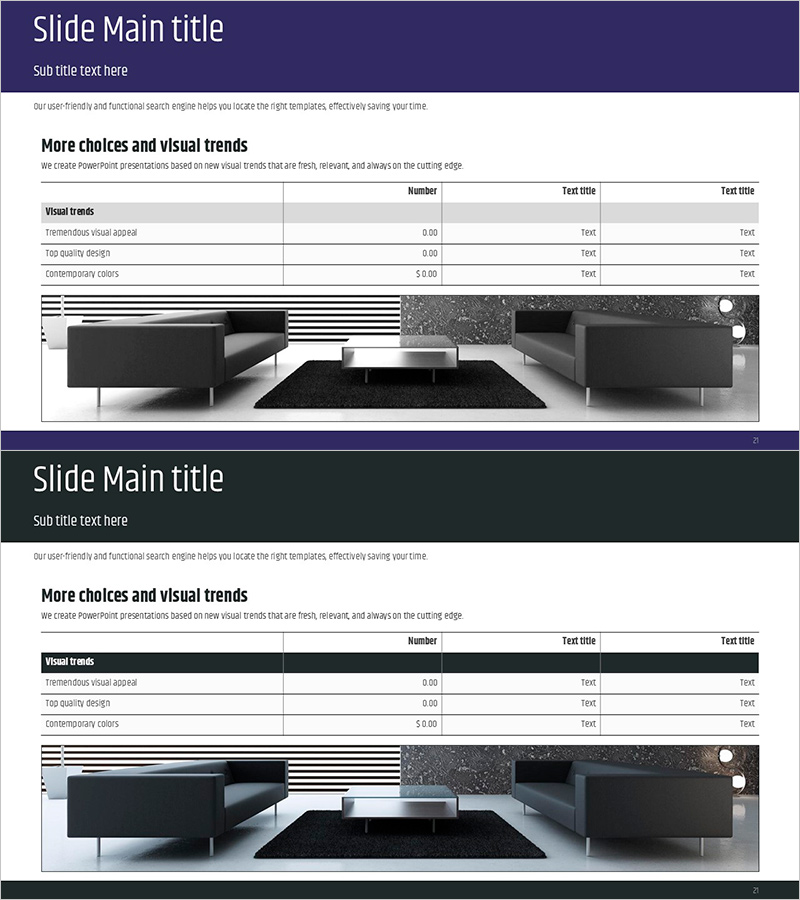
A 2-slide PowerPoint presentation set designed to visualize financial planning and performance metrics. The slides feature a dark-toned modern interior photograph as the background, with a title section at the top and a 3-column data table in the middle section. The numerical input fields and text labels are clearly differentiated, enabling intuitive representation of financial indicators, budget status, and performance comparisons. Available in 16:9 widescreen PPTX format for immediate editing. This presentation template is suitable for investor pitches, financial reports, executive briefings, and various business scenarios requiring data-driven communication.
Usage Points
-
Main Usage
This slide effectively visualizes financial metrics, budget status, quarterly performance, and return on investment figures. The 3-column table layout facilitates comparative analysis, while the modern interior background reinforces corporate professionalism and credibility.
-
How to Use
Enter the slide topic (e.g., Financial Status, Budget Allocation, Performance Analysis) in the title section at the top. Fill in the table cells with numerical values and item labels. Ensure clear header rows and columns for data readability, and apply accent colors to highlight key figures when necessary.
-
Recommended For
CFOs, financial managers, executives, and investor relations professionals can use this template for financial reports, investor relations materials, executive briefings, and quarterly performance presentations. It is particularly effective in data-driven decision-making meetings and investor pitches.
-
Slide Structure
The 2-slide set features a title section at the top (1 field), a data table section in the middle (3 columns × 3+ rows), and an image section at the bottom. Provides 6+ text input fields and 9+ numerical input cells for comprehensive data representation.
Related Products
-

Travel Budget and Expense Planning Slide
#Financial Plans and Performance #Diagram #Capital Requirements
-

Estimated Budget Breakdown – Financial Planning and Budget Management
#Financial Plans and Performance #Diagram #Capital Requirements
-

Interior Cost Plan PowerPoint – Budget Table Dark
#Financial Plans and Performance #Diagram #Capital Requirements
-

Sea Lighthouse Sales and Profit Table – Effective Analysis in Blue Green
#Financial Plans and Performance #Diagram #Capital Requirements
