Global Travel Market Trends – Insights Through Data Visualization
RJ0600080_26
- Last Update 07/11/2025
- File Size 1.8MB
- # of Slides 2
- File Format PPTX
- Slide Ratio 16:9
- Color
Keywords
- #Content-Based Slides
- #Design-Based Slides
- #Financial Plans and Performance
- #Diagram
- #Graph
- #Capital Requirements
- #Budget
- #Table
- #Column
- #Grouped Column
- #16:9
- #grouped column chart PowerPoint
- #bar chart slide template
- #year-over-year comparison graph
- #market trend data visualization
- #PowerPoint chart slide design
About the Product
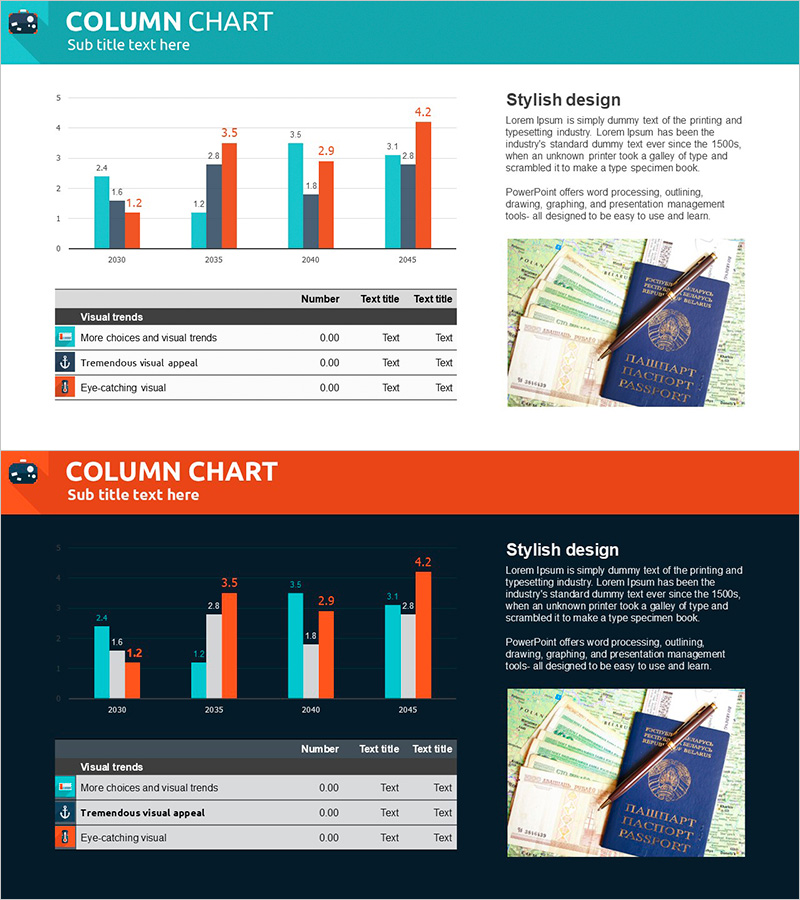
A grouped column chart PowerPoint slide designed to visualize year-over-year market trends and comparative data analysis. Features three data series in teal, orange, and red across four years (2030–2045), with numeric labels displayed above each bar for precise value communication. Includes a legend table below the chart for enhanced visual clarity and professional presentation. Ideal for business reports, financial presentations, and market analysis slides. Provided in 16:9 widescreen PPTX format with fully editable colors, values, and legend entries.
Usage Points
-
Main Usage
Compares multiple data series across time periods or categories using grouped column visualization. Effectively communicates market trends, sales performance, budget forecasts, and comparative metrics. The three-series layout enables simultaneous comparison and relationship identification across datasets.
-
How to Use
Insert into business reports, financial presentations, market analysis slides, or investor pitch decks. Replace existing data via copy-paste functionality, and customize colors, labels, and legend entries to match your presentation context and corporate branding.
-
Recommended For
Executives, data analysts, marketers, financial officers, and consultants presenting data-driven insights. Suitable for quarterly performance reviews, annual business planning presentations, investor relations meetings, market research reports, and comparative financial analysis.
-
Slide Structure
Teal header section with title placeholder; central grouped column chart spanning four years (2030, 2035, 2040, 2045) with three data series (teal, orange, red bars); Y-axis scale 0–5; numeric labels above each bar; legend table at bottom with three visual trend categories and corresponding data fields.
Related Products
-

Blue Line Wide Template Table2 – Stylish Design for Financial Planning
#Financial Plans and Performance #Diagram #Capital Requirements
-

Table Chart and Arrow Signs
#Financial Plans and Performance #Diagram #Capital Requirements
-

Interior Cost Plan PowerPoint – Budget Table Dark
#Financial Plans and Performance #Diagram #Capital Requirements
-

Travel Budget and Expense Planning Slide
#Financial Plans and Performance #Diagram #Capital Requirements
