Speaking Highlight Messages and Tables – Effective Business Performance Delivery
RJ0600065_13
- Last Update 07/07/2025
- File Size 0.1MB
- # of Slides 2
- File Format PPTX
- Slide Ratio 16:9
- Color
Keywords
About the Product
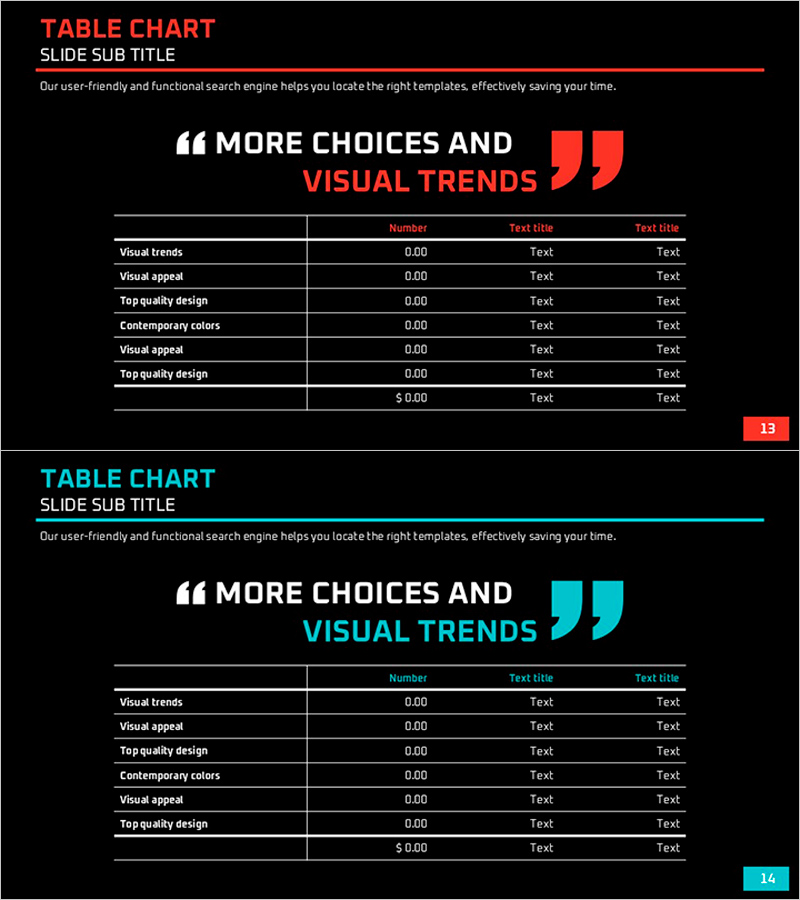
A 2-slide set designed to clearly present business performance and financial data through table-based layouts. Featuring red and cyan dual-tone backgrounds with white table structures that emphasize numerical comparisons, each slide employs a two-column layout with text on the left and data table on the right. Both slides include a 6-row by 3-column editable table, large quotation mark icon, and title area, making them immediately applicable to business plans, investor pitch decks, and performance reports. Delivered in PowerPoint PPTX format with fully editable elements and optimized for 16:9 widescreen displays for modern projectors and online presentations.
Usage Points
-
Main Usage
Present business metrics, financial indicators, and market data in clear tabular format for direct comparison. The two-column structure allows key messages on the left while specific figures appear in the right-side table, enhancing audience comprehension of data-driven insights.
-
How to Use
Apply to investor presentations, business plans, performance reports, and financial analysis meetings when comparing critical metrics. Input numerical data directly into table cells and add interpretive text or insights in the left text area to create data-backed decision-support slides.
-
Recommended For
CFOs, financial analysts, business development teams, marketing analysts, and executives responsible for data-driven presentations. Particularly effective for quarterly performance reviews, investor meetings, and executive-level internal reporting.
-
Slide Structure
Each slide contains a title area (top), large quotation mark icon (top-left), left-side text input area (100–150 characters), and right-side 6×3 table (18 editable cells). Table headers use color emphasis while data rows maintain white backgrounds for readability; all text boxes and cells are fully editable.
Related Products
-

Data Analysis Table – Visualization of Financial Planning and Performance
#Financial Plans and Performance #Diagram #Balance Sheet
-

Box Wide Table Template for Financial Planning
#Financial Plans and Performance #Diagram #Cash Flow Statement
-

Table Chart with Light Background – Financial Planning Tool
#Financial Plans and Performance #Diagram #Cash Flow Statement
-

Key Financial Indicators Comparison – Cash Flow and Performance Analysis
#Financial Plans and Performance #Diagram #Cash Flow Statement
