Up-Down Flow Diagram – Visualizing Business Strategy
RJ0600065_12
- Last Update 07/07/2025
- File Size 0.1MB
- # of Slides 2
- File Format PPTX
- Slide Ratio 16:9
- Color
Keywords
About the Product
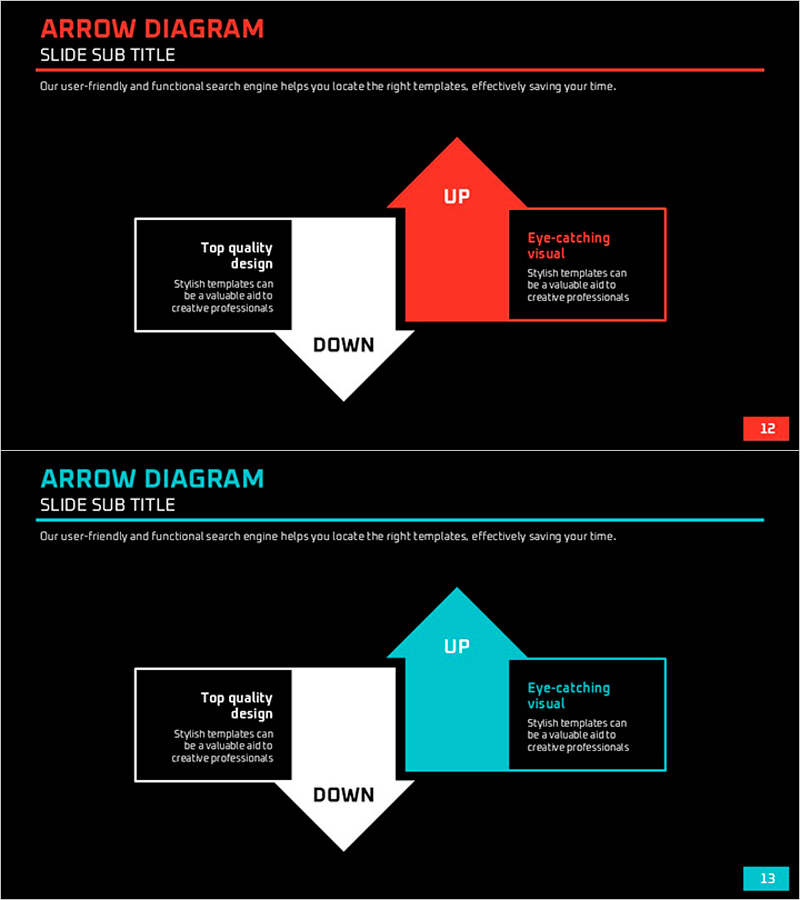
A directional up-down arrow diagram PowerPoint slide that clearly expresses upward and downward movements in business contexts. Provided in two color versions—red and cyan—with a symmetrical structure centered on a diamond node. The left and right text boxes enable simultaneous explanation of contrasting concepts or scenarios, making it ideal for business strategy presentations, decision-making processes, and performance analysis. Composed of 2 slides in 16:9 widescreen format, ready for immediate editing and customization.
Usage Points
-
Main Usage
Optimized for visually comparing two contrasting concepts such as growth versus decline, positive versus negative, or strengths versus weaknesses. The central diamond node symbolizes a decision point or turning point, while the opposing arrows clearly distinguish the outcomes or impacts of each direction.
-
How to Use
Use in business strategy presentations to explain growth opportunities alongside risk factors, or in decision-making processes to compare pros and cons of different options. Enter one concept (e.g., strengths, opportunities) in the left text box and the contrasting concept (e.g., weaknesses, threats) in the right box to present balanced analysis.
-
Recommended For
Recommended for executive and strategy team business direction presentations, marketing team opportunity-threat analysis, finance team profitability-loss comparisons, and project team go-no-go decision presentations. Effective in consulting reports, quarterly performance reviews, and new business proposals.
-
Slide Structure
Composed of 2 slides. Each slide features a central diamond node with a red or cyan arrow pointing upward and a white arrow pointing downward. Text boxes are symmetrically positioned on the left and right sides. Title and descriptive text areas are clearly separated for easy customization.
Related Products
-

PowerPoint Template for Service Operation Strategy Presentation
#Business Management #Operational Plan #Technical Approach
-

Flow Diagram and Table – Visualizing Business Strategy
#Business Strategy #Business Management #Diagram
-

100% Stacked Column Chart by Subject – Effective Market Analysis
#Market and Competitor Analysis #Diagram #Graph
-

Introducing the Fintech Program – Innovative Financial Management
#Product/Service Introduction #Business Management #Diagram
